Layout#
On this page, you'll learn more about the Dashboard Layout system. You'll discover how to modify it and explore some of the fundamental possibilities it offers.
Currently, the available Layout items include:
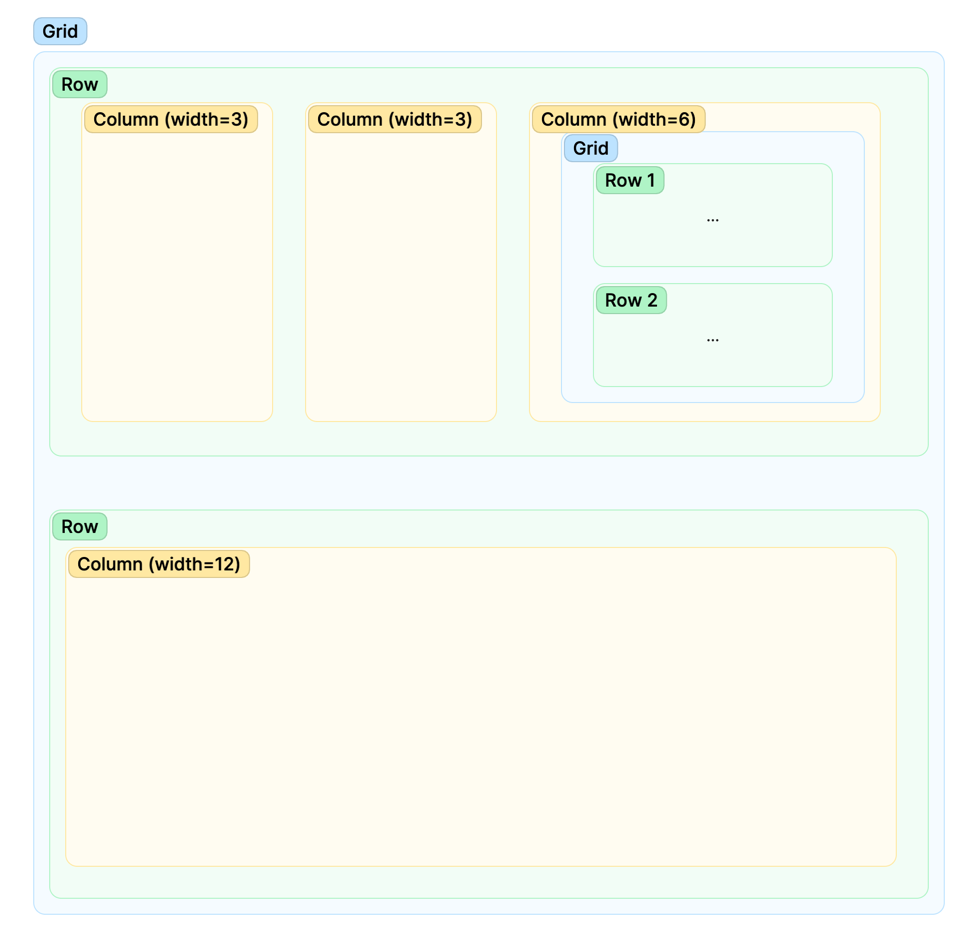
The Grid item serves as a container for arranging multiple row items. This tool can be employed at the top level of the Dashboard or nested within other elements like Columns or Tab Sections.
With the Grid, each row is divided into 12 columns, which can be allocated to Columns using the width parameter. This allows for flexible arrangements, such as one Column with a width of 12, or two Columns each with a width of 6, and so on. If the width parameter isn't specified, columns will be evenly divided.
Each column features a content parameter for specifying its content. The content can include any of the following:
- Widget
- Grid
- Tab Section
The diagram below illustrates how the Grid can be arranged:

Grid#
Now, let's explore how to adapt your Dashboard using the Grid system. To begin, you'll need to incorporate the Grid into your Dashboard:
Each element within the Grid is assigned to a separate row.
The arrangement of these elements is important as it follows their sequential definition, with items positioned in the same order as they are declared.
Row#
Let's now proceed to include two widgets within the same row. In this example, we'll
position the table_widget and timeseries_widget in the same row.
The resulting code will be as follows:
If you publish the Dashboard now:
engineai dashboard publish
You will see that the two widgets are in the same row, but the width of the columns is not defined, so they are equally divided.
Column#
Let's now change the width of the columns, so that the table_widget has
a width of 4 and the timeseries_widget has a width of 8. To do this, we will use
the Column item.
Publish the Dashboard now:
engineai dashboard publish
You will see that the two widgets are still in the same row, but the width of the columns is now defined.
Tab Section#
Lastly, let's incorporate a Tab Section into the Dashboard. The Tab Section functions as a container for numerous Tabs, where each Tab consists of a label and corresponding content.
In this instance, we will utilize generate_table_widget, a simple function that generates simple table widgets to help you understanding the changes done by the layout changes. Thus, we generate two table widget examples as the content for the tabs.
Doing so will result in the following code:
To finalize the changes, publish the Dashboard:
engineai dashboard publish
Upon completion, you'll see that two new table widgets are now nested within a Tab Section, featuring two separate Tabs - one for each table.
This should be the final version of your dashboard.
Have any thoughts? Please don't hesitate to share them with us at https://engineai.com/feedback
Next Steps#
You have now learned the basics of the Layout system, you're now equipped to create simple dashboards.
Feel free to explore the API Reference to continue customizing your own Dashboards to suit your requirements.