Your First Dashboard with Engine AI SDK#
This guide will walk you through creating your first interactive dashboard using the Engine AI SDK. We'll build a simple pie chart showing sales data by region in just a few lines of code.
Prerequisites#
Step 1: Create Workspace, App, and Dashboard via CLI#
First, we'll use the CLI to create the necessary entities in the Engine AI platform.
Create a Workspace#
Run the command below to create your workspace:
For example:
This will create a new workspace with slug my-workspace and name My Workspace.
Slugs and names are unique
The workspace slug and name must each be unique across the entire platform.
Create an App#
Next, create an app within your workspace:
For example:
This command creates a new app with slug my-app and name My App under the workspace my-workspace.
Create a Dashboard#
Finally, create the dashboard:
For example:This command creates a new dashboard with slug first-dashboard and name My First Dashboard under the app my-app and workspace my-workspace.
Verify your Setup#
As a final verification, list the dashboards within your app to ensure your new dashboard is present:
Replace <workspace-slug> and <app-slug> with your actual workspace and app slugs. For example:
Now you're ready to start coding and create your first dashboard layout!
Step 2: Import Required Components#
Begin by creating dashboard.py and importing the necessary components:
import pandas as pd

from engineai.sdk.dashboard.dashboard import Dashboard
from engineai.sdk.dashboard.widgets import pie
Step 3: Setup Data#
Prepare the sample sales data for the pie chart. We'll use a simple pandas DataFrame for this:
data = pd.DataFrame(
    {
        "region": [
            "North America",
            "Europe",
            "Asia Pacific",
            "Latin America",
            "Africa",
        ],
        "sales": [45000, 32000, 28000, 15000, 8000],
    }
)
Step 4: Build the Pie Chart Widget#
Now, build the pie chart:
pie_widget = pie.Pie(
    data=data,
    title="Sales by Region - Q4 2024",
    series=pie.Series(
        category_column="region",  # This column defines the pie slices
        data_column="sales",  # This column defines the slice sizes
    ),
)
Step 5: Instantiate Dashboard#
Instantiate the dashboard layout with the pie chart widget:
if __name__ == "__main__":
    Dashboard(
        workspace_slug="my-workspace",
        app_slug="my-app",
        slug="first-dashboard",
        content=pie_widget,
    )
Publishing the dashboard
Instantiating the Dashboard class also publishes it to the Engine AI platform.
Step 6: Publish Dashboard#
Finally, in order to publish the dashboard, run the following command in your terminal:
Navigate to the URL provided by the script. Your new dashboard should appear as follows:
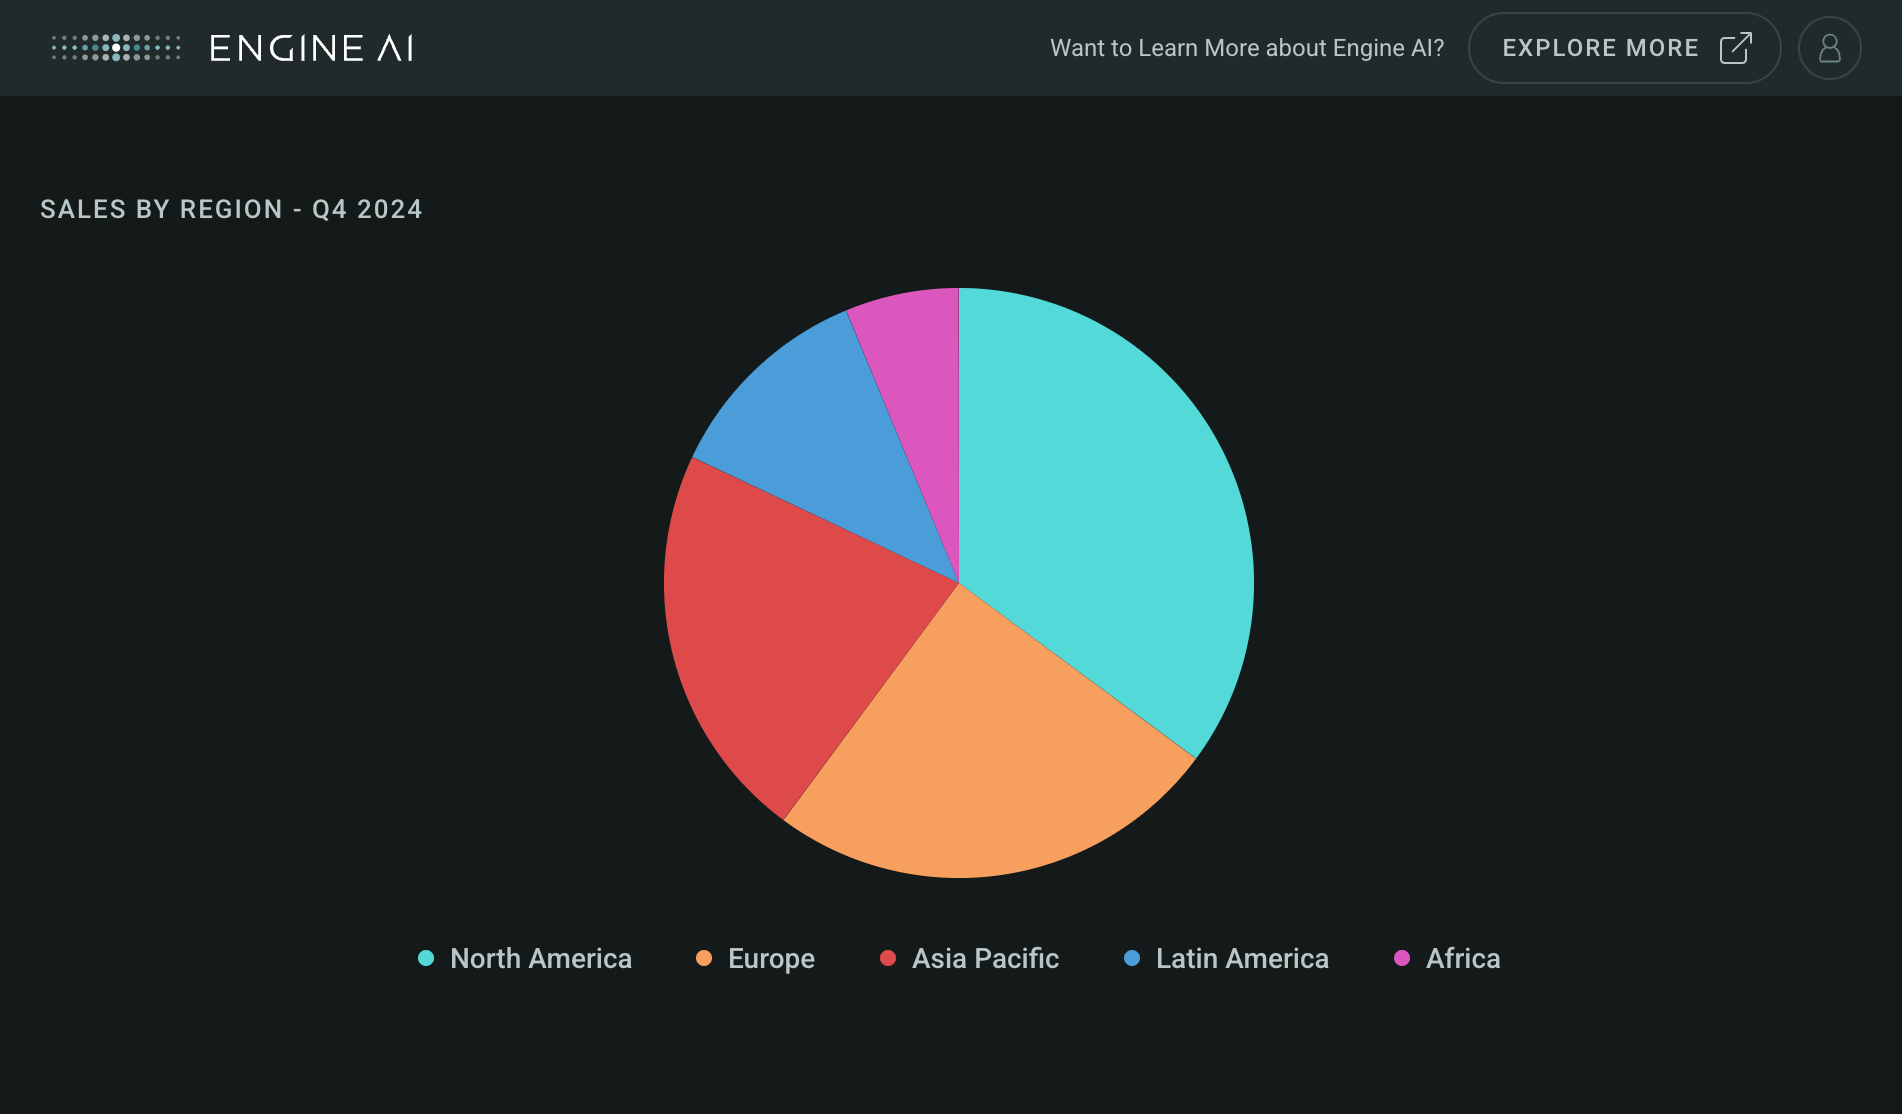
Congratulations! 🎉 You've successfully created your first interactive dashboard with the Engine AI SDK. This minimal example demonstrates how easy it is to get started with data visualization using the Engine AI platform.
Complete Example#
Here's the complete code that creates your first dashboard.
"""My first dashboard using Engine AI SDK."""

import pandas as pd

from engineai.sdk.dashboard.dashboard import Dashboard
from engineai.sdk.dashboard.widgets import pie

data = pd.DataFrame(
    {
        "region": [
            "North America",
            "Europe",
            "Asia Pacific",
            "Latin America",
            "Africa",
        ],
        "sales": [45000, 32000, 28000, 15000, 8000],
    }
)

pie_widget = pie.Pie(
    data=data,
    title="Sales by Region - Q4 2024",
    series=pie.Series(
        category_column="region",  # This column defines the pie slices
        data_column="sales",  # This column defines the slice sizes
    ),
)

if __name__ == "__main__":
    Dashboard(
        workspace_slug="my-workspace",
        app_slug="my-app",
        slug="first-dashboard",
        content=pie_widget,
    )