Cartesian#
Cartesian #
Cartesian(
    data: DataType | DataFrame,
    *,
    widget_id: str | None = None,
    x_axis: str | GenericLink | XAxis,
    left_y_axis: YAxisSeries | YAxis | None = None,
    right_y_axis: YAxisSeries | YAxis | None = None,
    legend_position: LegendPosition = BOTTOM,
    title: WidgetTitleType = "",
    enable_toolbar: bool = True,
)
Spec for Cartesian widget.
Constructor for Cartesian widget.
Parameters:
| Name | Type | Description | Default |
|---|---|---|---|
data
|
DataType | DataFrame
|
data to be used by widget. Accepts Storages as well as raw data. |
required |
widget_id
|
str | None
|
unique widget id in a dashboard. |
None
|
x_axis
|
str | GenericLink | XAxis
|
spec for X Axis. |
required |
left_y_axis
|
YAxisSeries | YAxis | None
|
spec for left Y Axis. |
None
|
right_y_axis
|
YAxisSeries | YAxis | None
|
spec for right Y Axis |
None
|
legend_position
|
LegendPosition
|
location of position relative to data, charts. |
BOTTOM
|
title
|
WidgetTitleType
|
title of widget can be either a string (fixed value) or determined by a value from another widget using a WidgetLink. |
''
|
enable_toolbar
|
bool
|
Enable/Disable toolbar flag. |
True
|
Examples:#
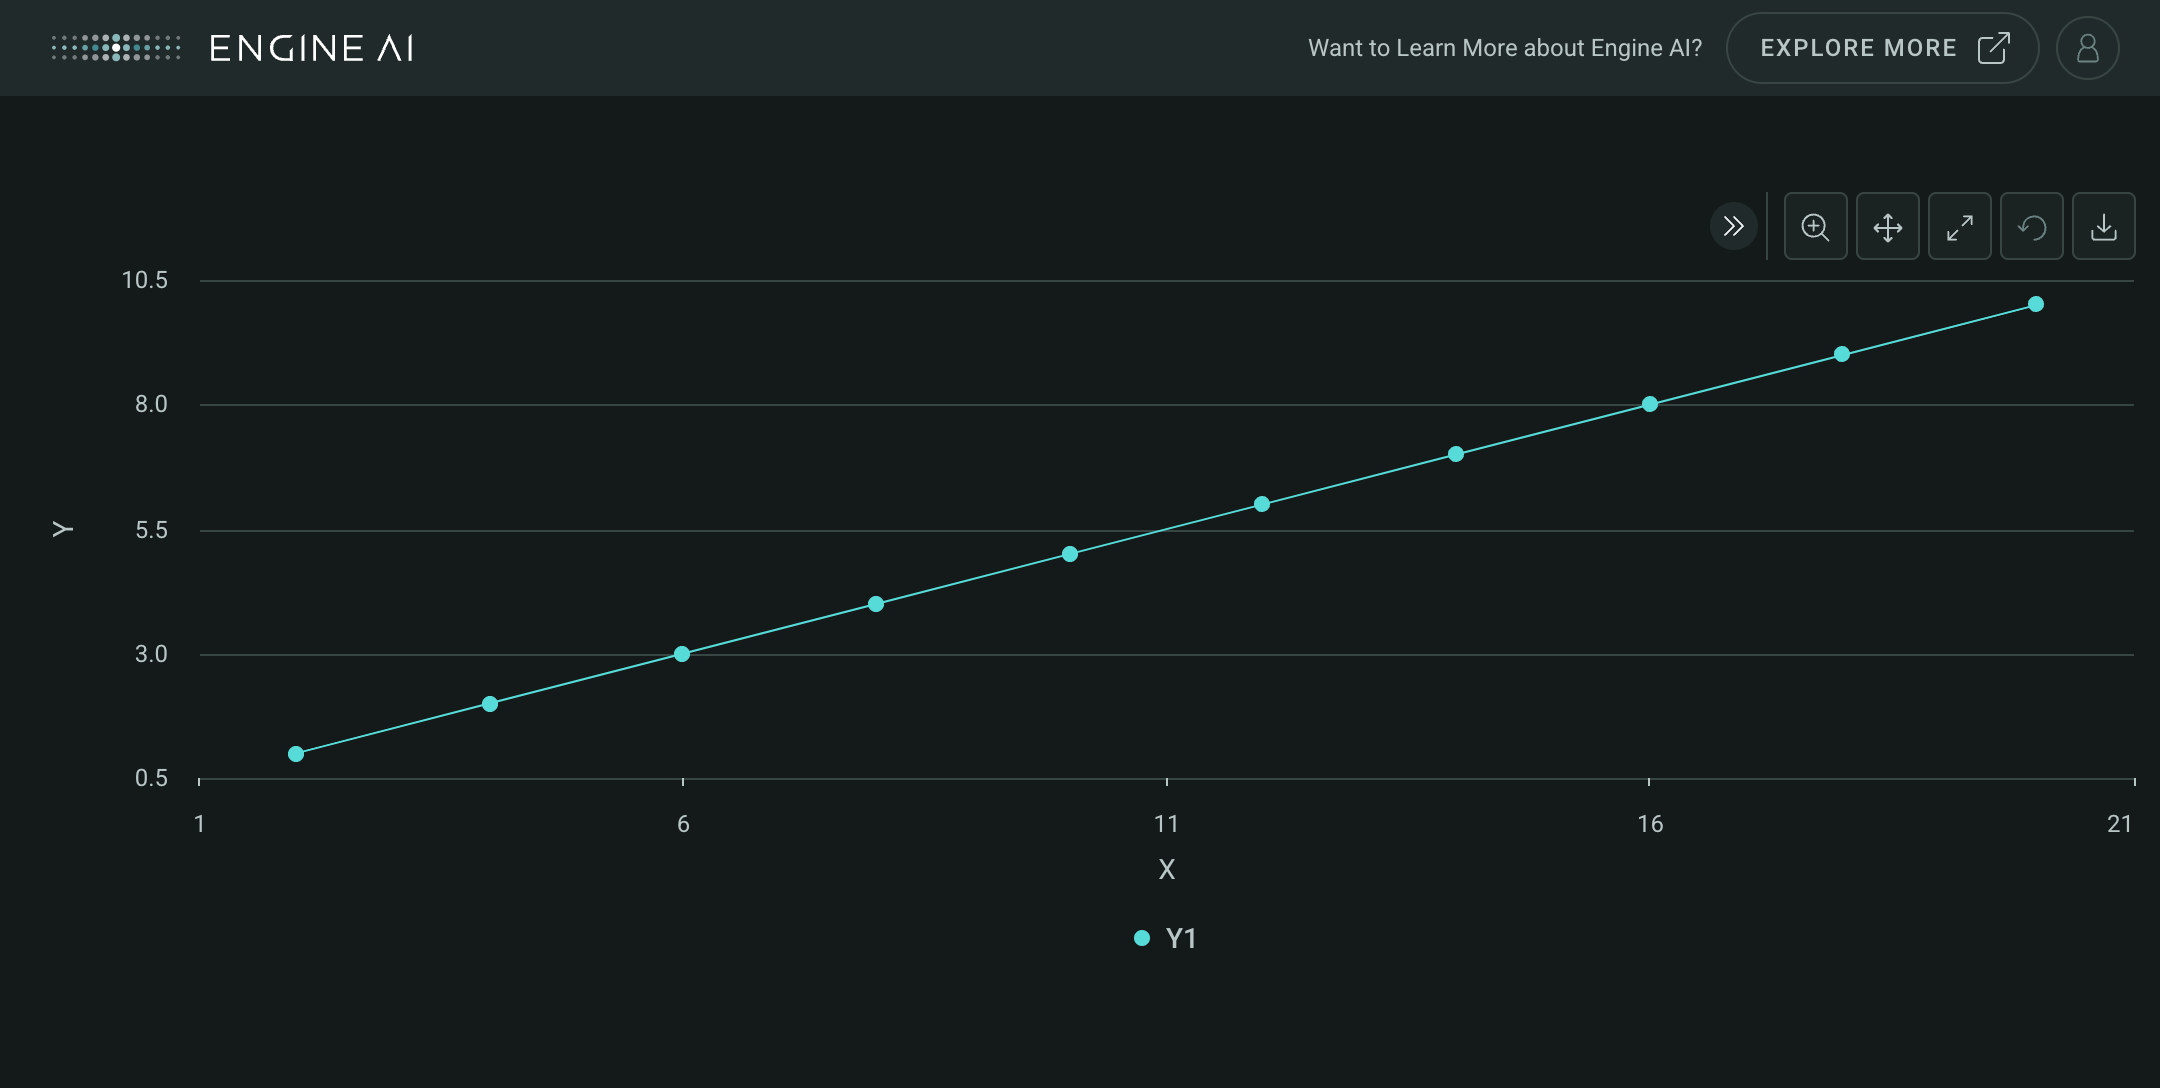
Create a minimal Cartesian widget
import pandas as pd

from engineai.sdk.dashboard.dashboard import Dashboard
from engineai.sdk.dashboard.widgets import cartesian

data = pd.DataFrame(
    {"x1": [2, 4, 6, 8, 10, 12, 14, 16, 18, 20], "y1": [1, 2, 3, 4, 5, 6, 7, 8, 9, 10]}
)

cartesian_widget = cartesian.Cartesian(
    data=data,
    x_axis="x1",
)

Dashboard(
    workspace_slug="my-workspace",
    app_slug="my-app",
    slug="first-dashboard",
    content=cartesian_widget,
)
Data#
This widget works with tabular data, typically in the form of a Pandas DataFrame.
Components#
Construct charts and axes for Cartesian widget.
Construct different components such as charts and axes for a Cartesian widget.
Chart #
Chart(
    x_axis: str | GenericLink | XAxis,
    *,
    data: DataFrame | None = None,
    left_y_axis: YAxisSeries | YAxis | None = None,
    right_y_axis: YAxisSeries | YAxis | None = None,
)
Spec for charts in a Cartesian widget.
Construct a chart for a Cartesian widget.
Parameters:
| Name | Type | Description | Default |
|---|---|---|---|
data
|
DataFrame | None
|
Widget data. |
None
|
left_y_axis
|
YAxisSeries | YAxis | None
|
spec for left Y Axis. |
None
|
x_axis
|
str | GenericLink | XAxis
|
spec for X Axis. |
required |
right_y_axis
|
YAxisSeries | YAxis | None
|
spec for right Y Axis. |
None
|
XAxis #
XAxis(
    data_column: str | GenericLink,
    *,
    title: str | GenericLink = "X",
    enable_crosshair: bool = False,
    formatting: AxisNumberFormatting | None = None,
    scale: AxisScale | None = None,
)
Specs for X Axis of a Cartesian chart.
Construct x axis for a Cartesian chart.
Parameters:
| Name | Type | Description | Default |
|---|---|---|---|
data_column
|
str | GenericLink
|
name of column in pandas dataframe(s) used for X axis values. |
required |
title
|
str | GenericLink
|
axis title |
'X'
|
enable_crosshair
|
bool
|
whether to enable crosshair that follows either the mouse pointer or the hovered point. |
False
|
formatting
|
AxisNumberFormatting | None
|
formatting spec for axis labels. |
None
|
scale
|
AxisScale | None
|
X axis scale. |
None
|
YAxis #
YAxis(
    series: YAxisSeries,
    *,
    title: str | WidgetField = "Y",
    enable_crosshair: bool = False,
    formatting: AxisNumberFormatting | None = None,
    scale: AxisScale | None = None,
)
Specs for Y Axis of a Cartesian chart.
Construct y axis for a Cartesian chart.
Parameters:
| Name | Type | Description | Default |
|---|---|---|---|
series
|
YAxisSeries
|
Add series to Y axis. |
required |
title
|
str | WidgetField
|
axis title. |
'Y'
|
enable_crosshair
|
bool
|
whether to enable crosshair that follows either the mouse pointer or the hovered point. |
False
|
formatting
|
AxisNumberFormatting | None
|
formatting spec for axis labels. |
None
|
scale
|
AxisScale | None
|
Y Axis scale. |
None
|
Examples:#
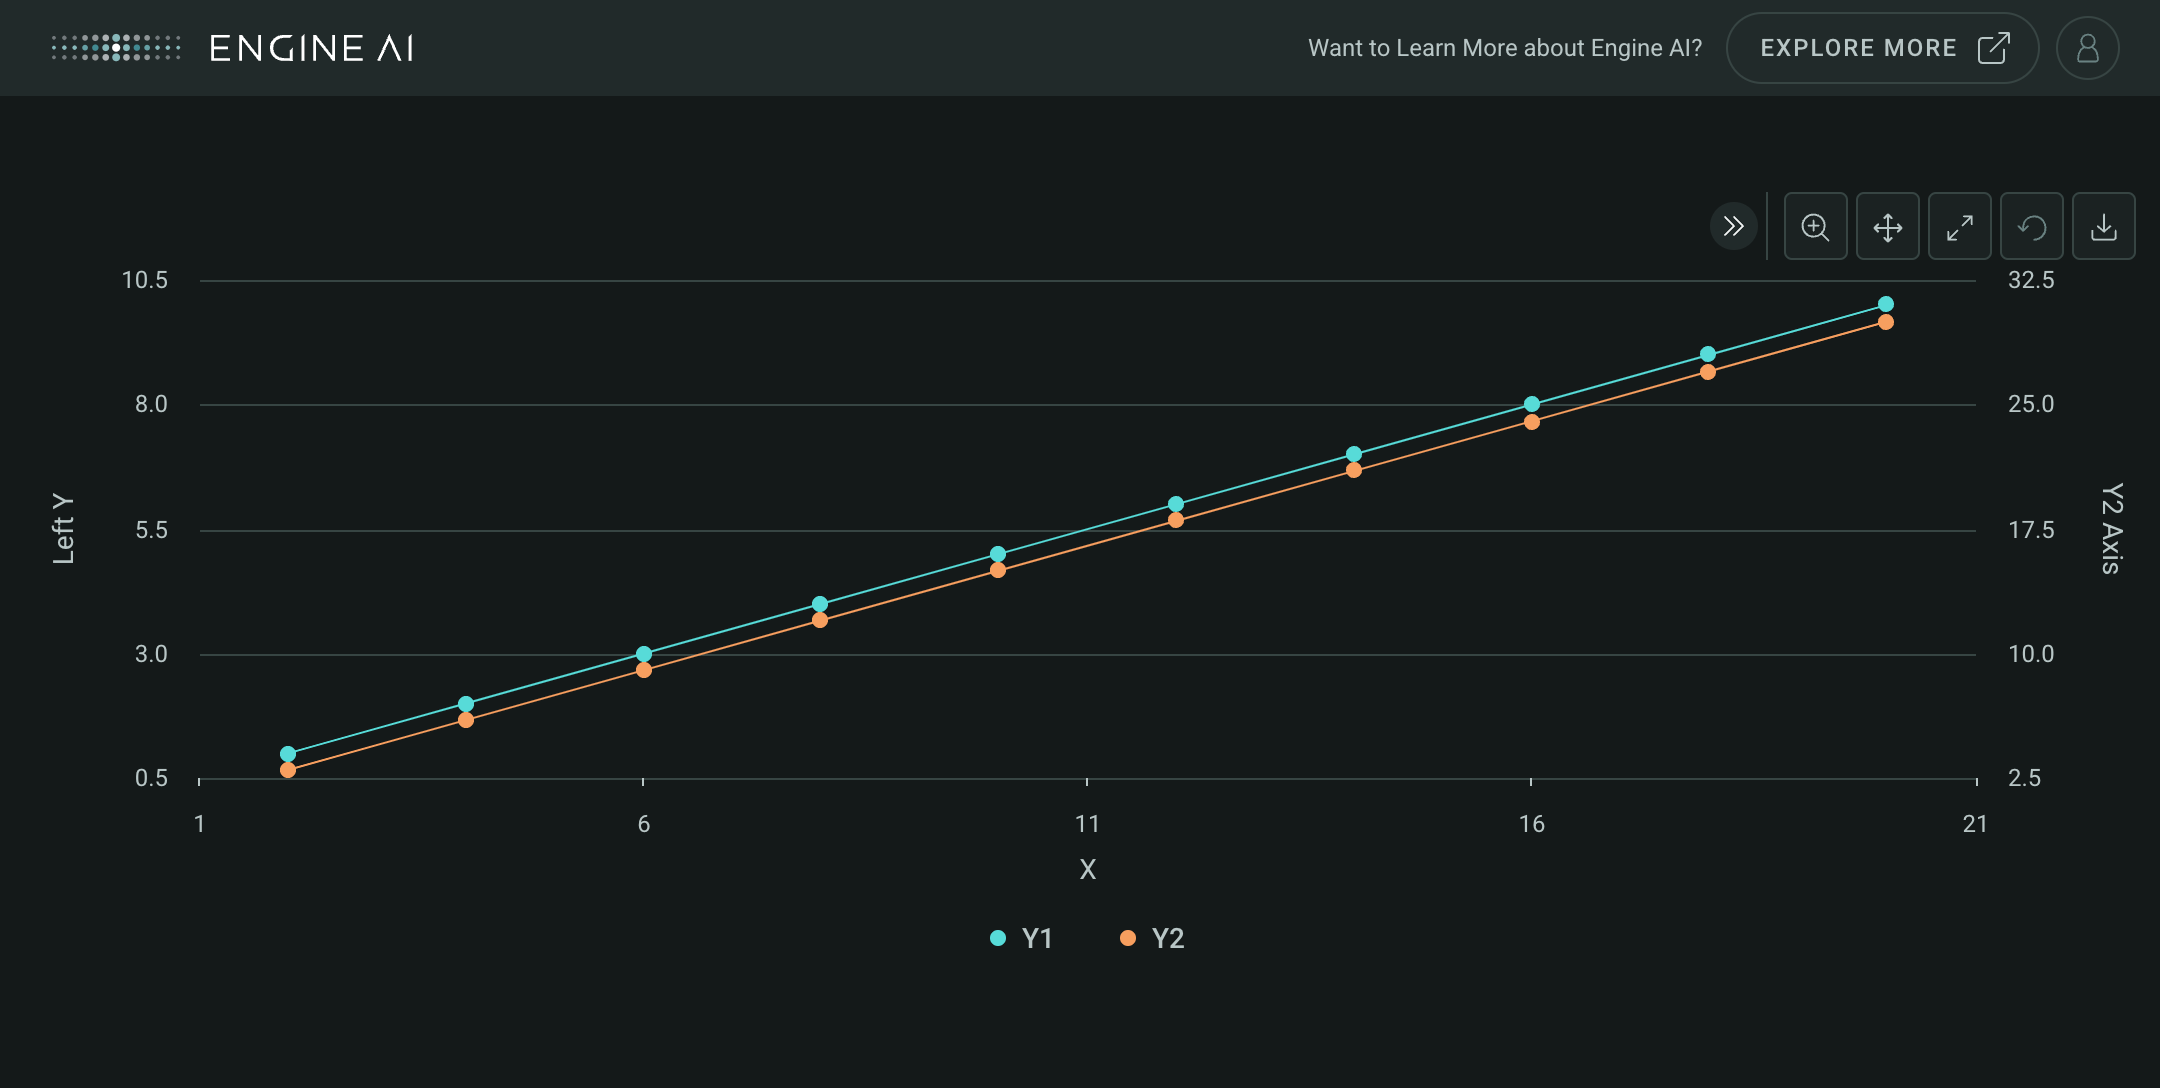
Create a minimal Cartesian widget with two YAxis
import pandas as pd

from engineai.sdk.dashboard.dashboard import Dashboard
from engineai.sdk.dashboard.widgets import cartesian

data = pd.DataFrame(
    {
        "x1": [2, 4, 6, 8, 10, 12, 14, 16, 18, 20],
        "y1": [1, 2, 3, 4, 5, 6, 7, 8, 9, 10],
        "y2": [3, 6, 9, 12, 15, 18, 21, 24, 27, 30],
    }
)

cartesian_widget = cartesian.Cartesian(
    data=data,
    x_axis="x1",
    left_y_axis="y1",
    right_y_axis=cartesian.YAxis(
        title="Y2 Axis",
        series="y2",
    ),
)

Dashboard(
    workspace_slug="my-workspace",
    app_slug="my-app",
    slug="first-dashboard",
    content=cartesian_widget,
)
LegendPosition #
Chart legend position options.
Options for positions of charts legend.
Attributes:
| Name | Type | Description |
|---|---|---|
RIGHT |
str
|
Legend is placed to the right of the chart. |
BOTTOM |
str
|
Legend is placed below the chart. |
RIGHT_GROUPED |
str
|
Legend is placed to the right of the chart and grouped with other legends. |
BOTTOM_GROUPED |
str
|
Legend is placed below the chart and grouped with other legends. |
NEXT_TO_DATA |
str
|
Legend is placed next to the data. |
Series#
Define series types.
Define various types of series such as area, area range, bubble, column, line, and scatter for a Cartesian widget.
CartesianBaseSeries #
CartesianBaseSeries(
    *,
    data_column: str | GenericLink | None = None,
    x_data_column: str | GenericLink | None = None,
    formatting: NumberFormatting | None = None,
    name: str | GenericLink | None = None,
    entity: Entities | None = None,
    show_in_legend: bool = True,
    required: bool = True,
    visible: bool = True,
    point_label_column: str | GenericLink | None = None,
    tooltips: TooltipItems | None = None,
)
Spec for the CartesianBaseSeries widget.
Spec for the CartesianBaseSeries widget.
Parameters:
| Name | Type | Description | Default |
|---|---|---|---|
data_column
|
str | GenericLink | None
|
name of column in pandas dataframe(s) used for the values of this series for the Y Axis. |
None
|
x_data_column
|
str | GenericLink | None
|
name of column in pandas dataframe(s) used for the values of this series for the X Axis. This column will override the data column defined in the X Axis instance. |
None
|
formatting
|
NumberFormatting | None
|
formatting spec for value associated with Y Axis. |
None
|
name
|
str | GenericLink | None
|
series name (shown in legend and tooltip). |
None
|
entity
|
Entities | None
|
entity spec. |
None
|
show_in_legend
|
bool
|
whether to show series in legend or not. |
True
|
required
|
bool
|
Flag to make the Series mandatory. If required == True and no Data the widget will show an error. If required==False and no Data, the widget hides the Series. |
True
|
visible
|
bool
|
Flag to make the Series visible when chart is loaded. |
True
|
point_label_column
|
str | GenericLink | None
|
name of column in dataframe(s) used for label of each point. |
None
|
tooltips
|
TooltipItems | None
|
tooltip items to be displayed at Series level. |
None
|
AreaSeries #
AreaSeries(
    *,
    data_column: str | GenericLink,
    x_data_column: str | GenericLink | None = None,
    formatting: NumberFormatting | None = None,
    name: str | GenericLink | None = None,
    styling: Palette | AreaSeriesStyling | None = None,
    entity: Entities | None = None,
    show_in_legend: bool = True,
    required: bool = True,
    visible: bool = True,
    point_label_column: str | GenericLink | None = None,
    tooltips: TooltipItems | None = None,
)
Spec for a Area series of a Cartesian widget.
Construct area series.
Parameters:
| Name | Type | Description | Default |
|---|---|---|---|
data_column
|
str | GenericLink
|
name of column in pandas dataframe(s) used for the values of this series for the Y Axis. |
required |
x_data_column
|
str | GenericLink | None
|
name of column in pandas dataframe(s) used for the values of this series for the X Axis. This column will override the data column defined in the X Axis instance. |
None
|
formatting
|
NumberFormatting | None
|
formatting spec for value associated with Y Axis. |
None
|
name
|
str | GenericLink | None
|
series name (shown in legend and tooltip). |
None
|
styling
|
Palette | AreaSeriesStyling | None
|
styling spec. |
None
|
entity
|
Entities | None
|
entity spec. |
None
|
show_in_legend
|
bool
|
whether to show series in legend or not. |
True
|
required
|
bool
|
Flag to make the Series mandatory. If required == True and no Data the widget will show an error. If required==False and no Data, the widget hides the Series. |
True
|
visible
|
bool
|
Flag to make the Series visible when chart is loaded. |
True
|
point_label_column
|
str | GenericLink | None
|
name of column in dataframe(s) used for label of each point. |
None
|
tooltips
|
TooltipItems | None
|
tooltip items to be displayed at Series level. |
None
|
Examples:#
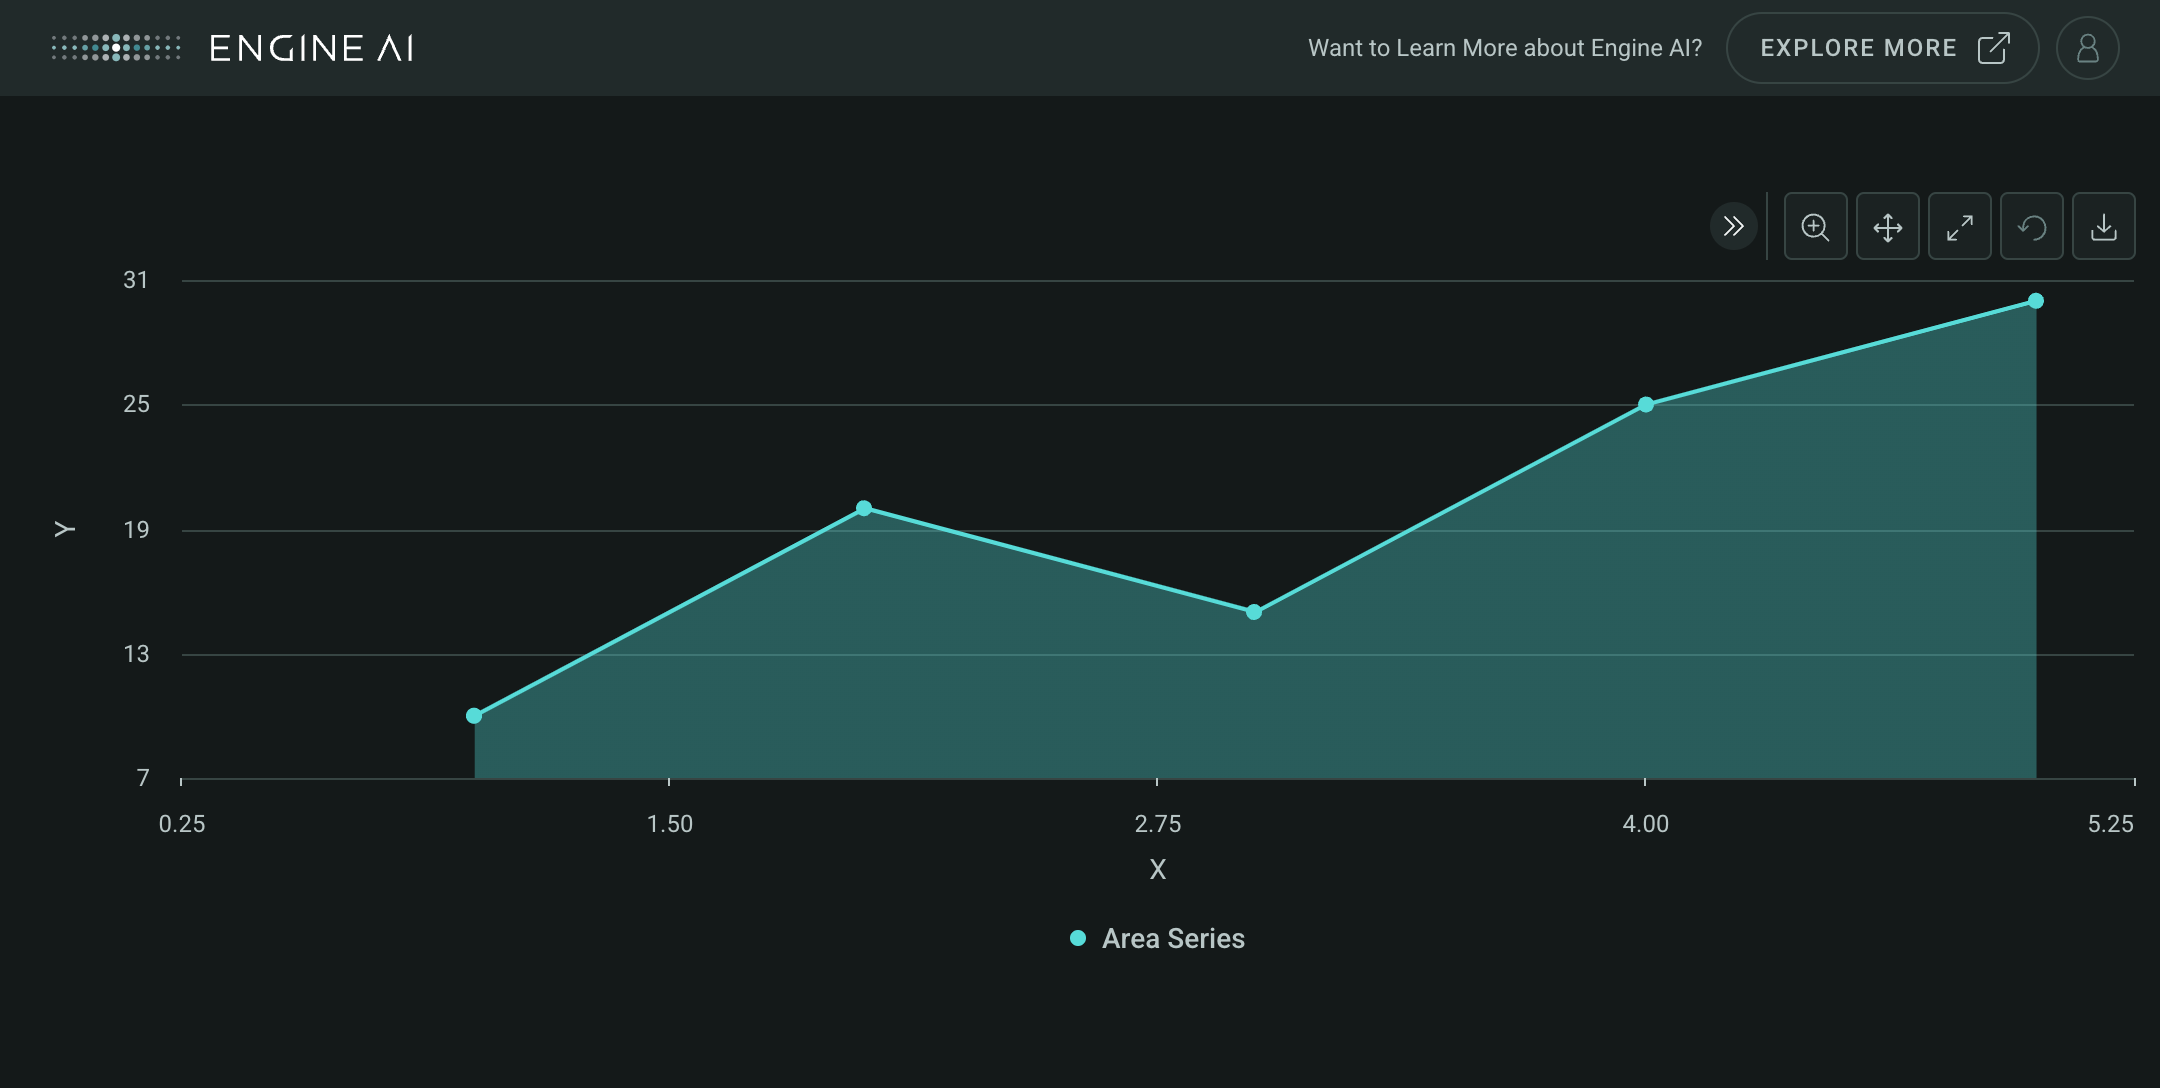
Create a Cartesian widget with AreaSeries
import pandas as pd

from engineai.sdk.dashboard.dashboard import Dashboard
from engineai.sdk.dashboard.widgets import cartesian

data_area = pd.DataFrame(
    {
        "x1": [1, 2, 3, 4, 5],
        "y1": [10, 20, 15, 25, 30],
    }
)

area_series = cartesian.AreaSeries(
    data_column="y1",
    name="Area Series",
)

cartesian_widget_area = cartesian.Cartesian(
    data=data_area,
    x_axis="x1",
    left_y_axis=area_series,
)

Dashboard(
    workspace_slug="my-workspace",
    app_slug="my-app",
    slug="first-dashboard",
    content=cartesian_widget_area,
)
AreaRangeSeries #
AreaRangeSeries(
    *,
    low_data_column: str | GenericLink,
    high_data_column: str | GenericLink,
    x_data_column: str | GenericLink | None = None,
    formatting: NumberFormatting | None = None,
    name: str | GenericLink,
    styling: Palette | AreaRangeSeriesStyling | None = None,
    entity: Entities | None = None,
    show_in_legend: bool = True,
    required: bool = True,
    visible: bool = True,
    point_label_column: str | GenericLink | None = None,
    tooltips: TooltipItems | None = None,
)
Spec for a area range series of a Cartesian widget.
Construct area range series.
Parameters:
| Name | Type | Description | Default |
|---|---|---|---|
low_data_column
|
str | GenericLink
|
name of column in pandas dataframe(s) used for the low values of this series. |
required |
high_data_column
|
str | GenericLink
|
name of column in pandas dataframe(s) used for the high values of this series. |
required |
x_data_column
|
str | GenericLink | None
|
name of column in pandas dataframe(s) used for the values of this series for the X Axis. This column will override the data column defined in the X Axis instance. |
None
|
formatting
|
NumberFormatting | None
|
formatting spec for value associated with Y Axis. |
None
|
name
|
str | GenericLink
|
series name (shown in legend and tooltip) |
required |
styling
|
Palette | AreaRangeSeriesStyling | None
|
styling spec. |
None
|
entity
|
Entities | None
|
entity spec. |
None
|
show_in_legend
|
bool
|
whether to show series in legend or not. |
True
|
required
|
bool
|
Flag to make the Series mandatory. If required == True and no Data the widget will show an error. If required==False and no Data, the widget hides the Series. |
True
|
visible
|
bool
|
Flag to make the Series visible when chart is loaded. |
True
|
point_label_column
|
str | GenericLink | None
|
name of column in dataframe(s) used for label of each point. |
None
|
tooltips
|
TooltipItems | None
|
tooltip items to be displayed at Series level. |
None
|
Examples:#
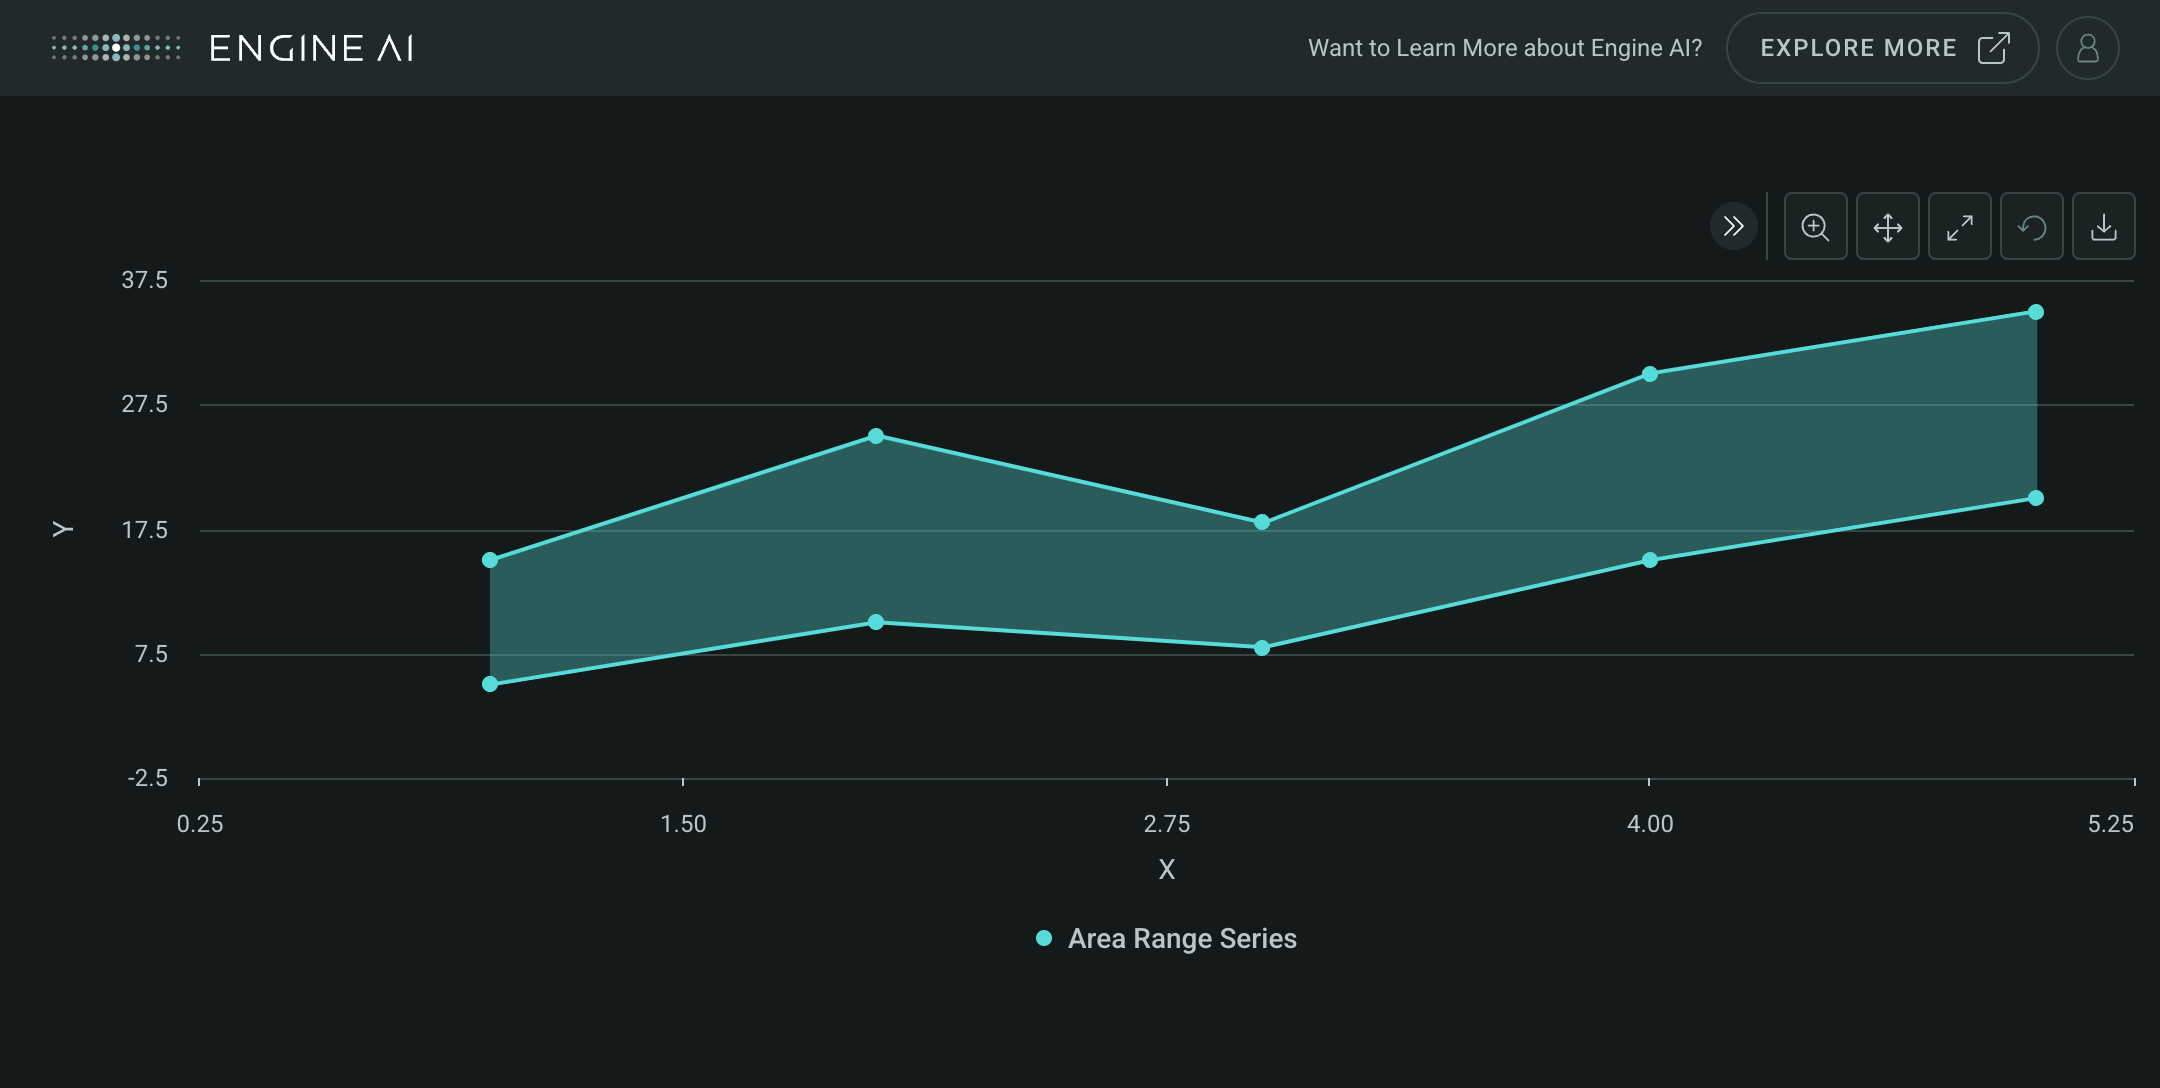
Create a Cartesian widget with AreaRangeSeries
import pandas as pd

from engineai.sdk.dashboard.dashboard import Dashboard
from engineai.sdk.dashboard.widgets import cartesian

data_area_range = pd.DataFrame(
    {
        "x1": [1, 2, 3, 4, 5],
        "low": [5, 10, 8, 15, 20],
        "high": [15, 25, 18, 30, 35],
    }
)

area_range_series = cartesian.AreaRangeSeries(
    name="Area Range Series",
    low_data_column="low",
    high_data_column="high",
)

cartesian_widget_area_range = cartesian.Cartesian(
    data=data_area_range,
    x_axis="x1",
    left_y_axis=area_range_series,
)

Dashboard(
    workspace_slug="my-workspace",
    app_slug="my-app",
    slug="first-dashboard",
    content=cartesian_widget_area_range,
)
BubbleSeries #
BubbleSeries(
    *,
    bubble_size_data_column: str | GenericLink,
    data_column: str | GenericLink,
    x_data_column: str | GenericLink | None = None,
    formatting: NumberFormatting | None = None,
    bubble_name: str | GenericLink | None = None,
    name: str | GenericLink | None = None,
    bubble_size_formatting: NumberFormatting | None = None,
    styling: Palette | BubbleSeriesStyling | None = None,
    entity: Entities | None = None,
    show_in_legend: bool = True,
    required: bool = True,
    visible: bool = True,
    point_label_column: str | GenericLink | None = None,
    tooltips: TooltipItems | None = None,
)
Spec for a bubble series of a Cartesian widget.
Construct bubble series.
Parameters:
| Name | Type | Description | Default |
|---|---|---|---|
data_column
|
str | GenericLink
|
name of column in pandas dataframe(s) used for the values of this series for the Y Axis. |
required |
x_data_column
|
str | GenericLink | None
|
name of column in pandas dataframe(s) used for the values of this series for the X Axis. This column will override the data column defined in the X Axis instance. |
None
|
formatting
|
NumberFormatting | None
|
formatting spec for value associated with Y Axis. |
None
|
name
|
str | GenericLink | None
|
series name (shown in legend and tooltip). |
None
|
bubble_name
|
str | GenericLink | None
|
name for the bubble value (show in tooltip). |
None
|
bubble_size_data_column
|
str | GenericLink
|
name of column in pandas dataframe(s) used for the values of this series associated with the size of the bubble. |
required |
bubble_size_formatting
|
NumberFormatting | None
|
formatting spec for value associated with bubbles. |
None
|
styling
|
Palette | BubbleSeriesStyling | None
|
styling spec. |
None
|
entity
|
Entities | None
|
entity spec. |
None
|
show_in_legend
|
bool
|
whether to show series in legend or not. |
True
|
required
|
bool
|
Flag to make the Series mandatory. If required == True and no Data the widget will show an error. If required==False and no Data, the widget hides the Series. |
True
|
visible
|
bool
|
Flag to make the Series visible when chart is loaded. |
True
|
point_label_column
|
str | GenericLink | None
|
name of column in dataframe(s) used for label of each point. |
None
|
tooltips
|
TooltipItems | None
|
tooltip items to be displayed at Series level. |
None
|
Examples:#
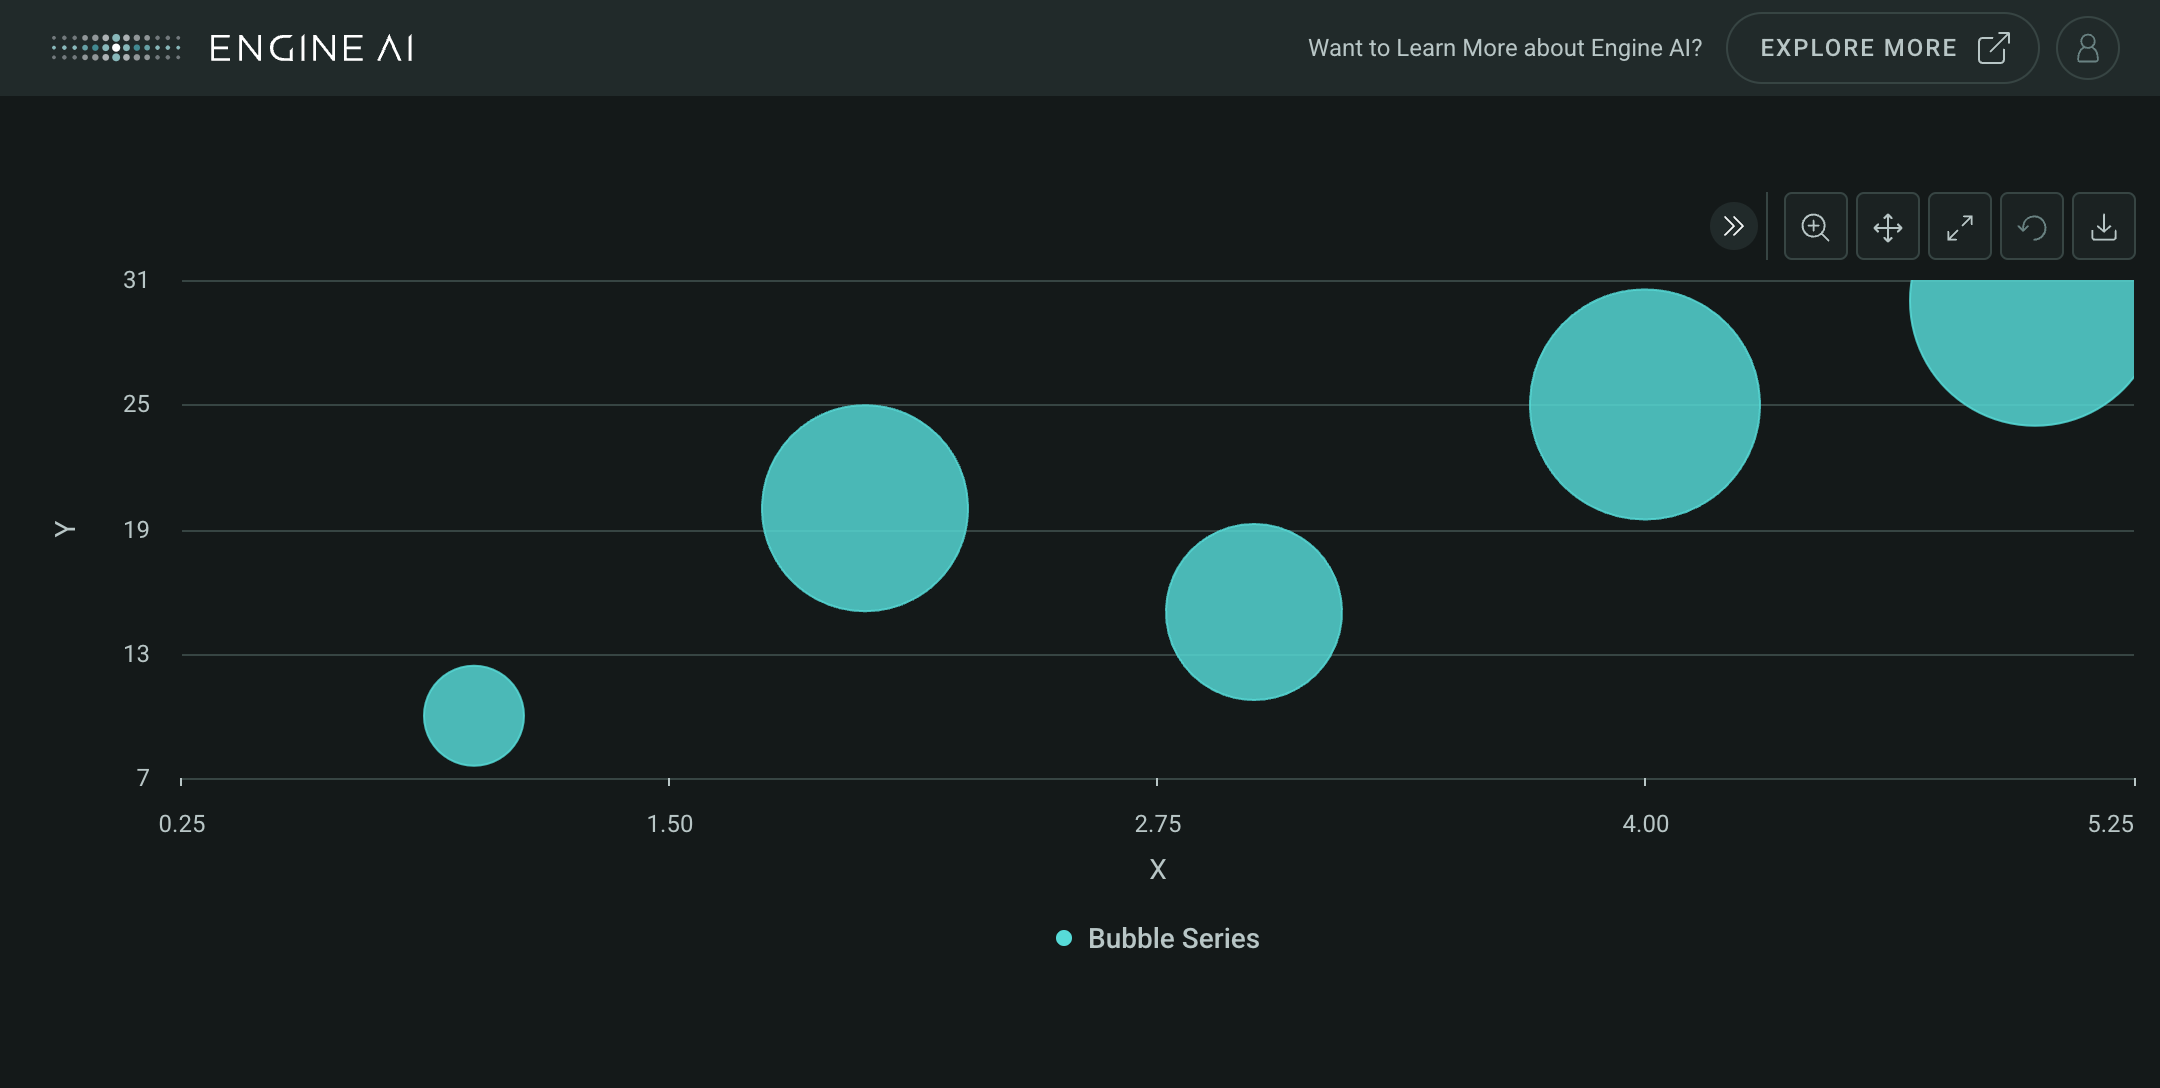
Create a Cartesian widget with BubbleSeries
import pandas as pd

from engineai.sdk.dashboard.dashboard import Dashboard
from engineai.sdk.dashboard.widgets import cartesian

data_bubble = pd.DataFrame(
    {
        "x1": [1, 2, 3, 4, 5],
        "y1": [10, 20, 15, 25, 30],
        "size": [5, 15, 10, 20, 25],
    }
)

bubble_series = cartesian.BubbleSeries(
    data_column="y1",
    bubble_size_data_column="size",
    name="Bubble Series",
)

cartesian_widget_bubble = cartesian.Cartesian(
    data=data_bubble,
    x_axis="x1",
    left_y_axis=bubble_series,
)

Dashboard(
    workspace_slug="my-workspace",
    app_slug="my-app",
    slug="first-dashboard",
    content=cartesian_widget_bubble,
)
ColumnSeries #
ColumnSeries(
    *,
    data_column: str | GenericLink,
    x_data_column: str | GenericLink | None = None,
    formatting: NumberFormatting | None = None,
    name: str | GenericLink | None = None,
    styling: Palette | ColumnSeriesStyling | None = None,
    entity: Entities | None = None,
    show_in_legend: bool = True,
    required: bool = True,
    visible: bool = True,
    point_label_column: str | GenericLink | None = None,
    tooltips: TooltipItems | None = None,
)
Spec for a column series of a Cartesian widget.
Construct column series.
Parameters:
| Name | Type | Description | Default |
|---|---|---|---|
data_column
|
str | GenericLink
|
name of column in pandas dataframe(s) used for the values of this series for the Y Axis. |
required |
x_data_column
|
str | GenericLink | None
|
name of column in pandas dataframe(s) used for the values of this series for the X Axis. This column will override the data column defined in the X Axis instance. |
None
|
formatting
|
NumberFormatting | None
|
formatting spec for value associated with Y Axis. |
None
|
name
|
str | GenericLink | None
|
series name (shown in legend and tooltip). |
None
|
styling
|
Palette | ColumnSeriesStyling | None
|
styling spec. |
None
|
entity
|
Entities | None
|
entity spec. |
None
|
show_in_legend
|
bool
|
whether to show series in legend or not. |
True
|
required
|
bool
|
Flag to make the Series mandatory. If required == True and no Data the widget will show an error. If required==False and no Data, the widget hides the Series. |
True
|
visible
|
bool
|
Flag to make the Series visible when chart is loaded. |
True
|
point_label_column
|
str | GenericLink | None
|
name of column in dataframe(s) used for label of each point. |
None
|
tooltips
|
TooltipItems | None
|
tooltip items to be displayed at Series level. |
None
|
Examples:#
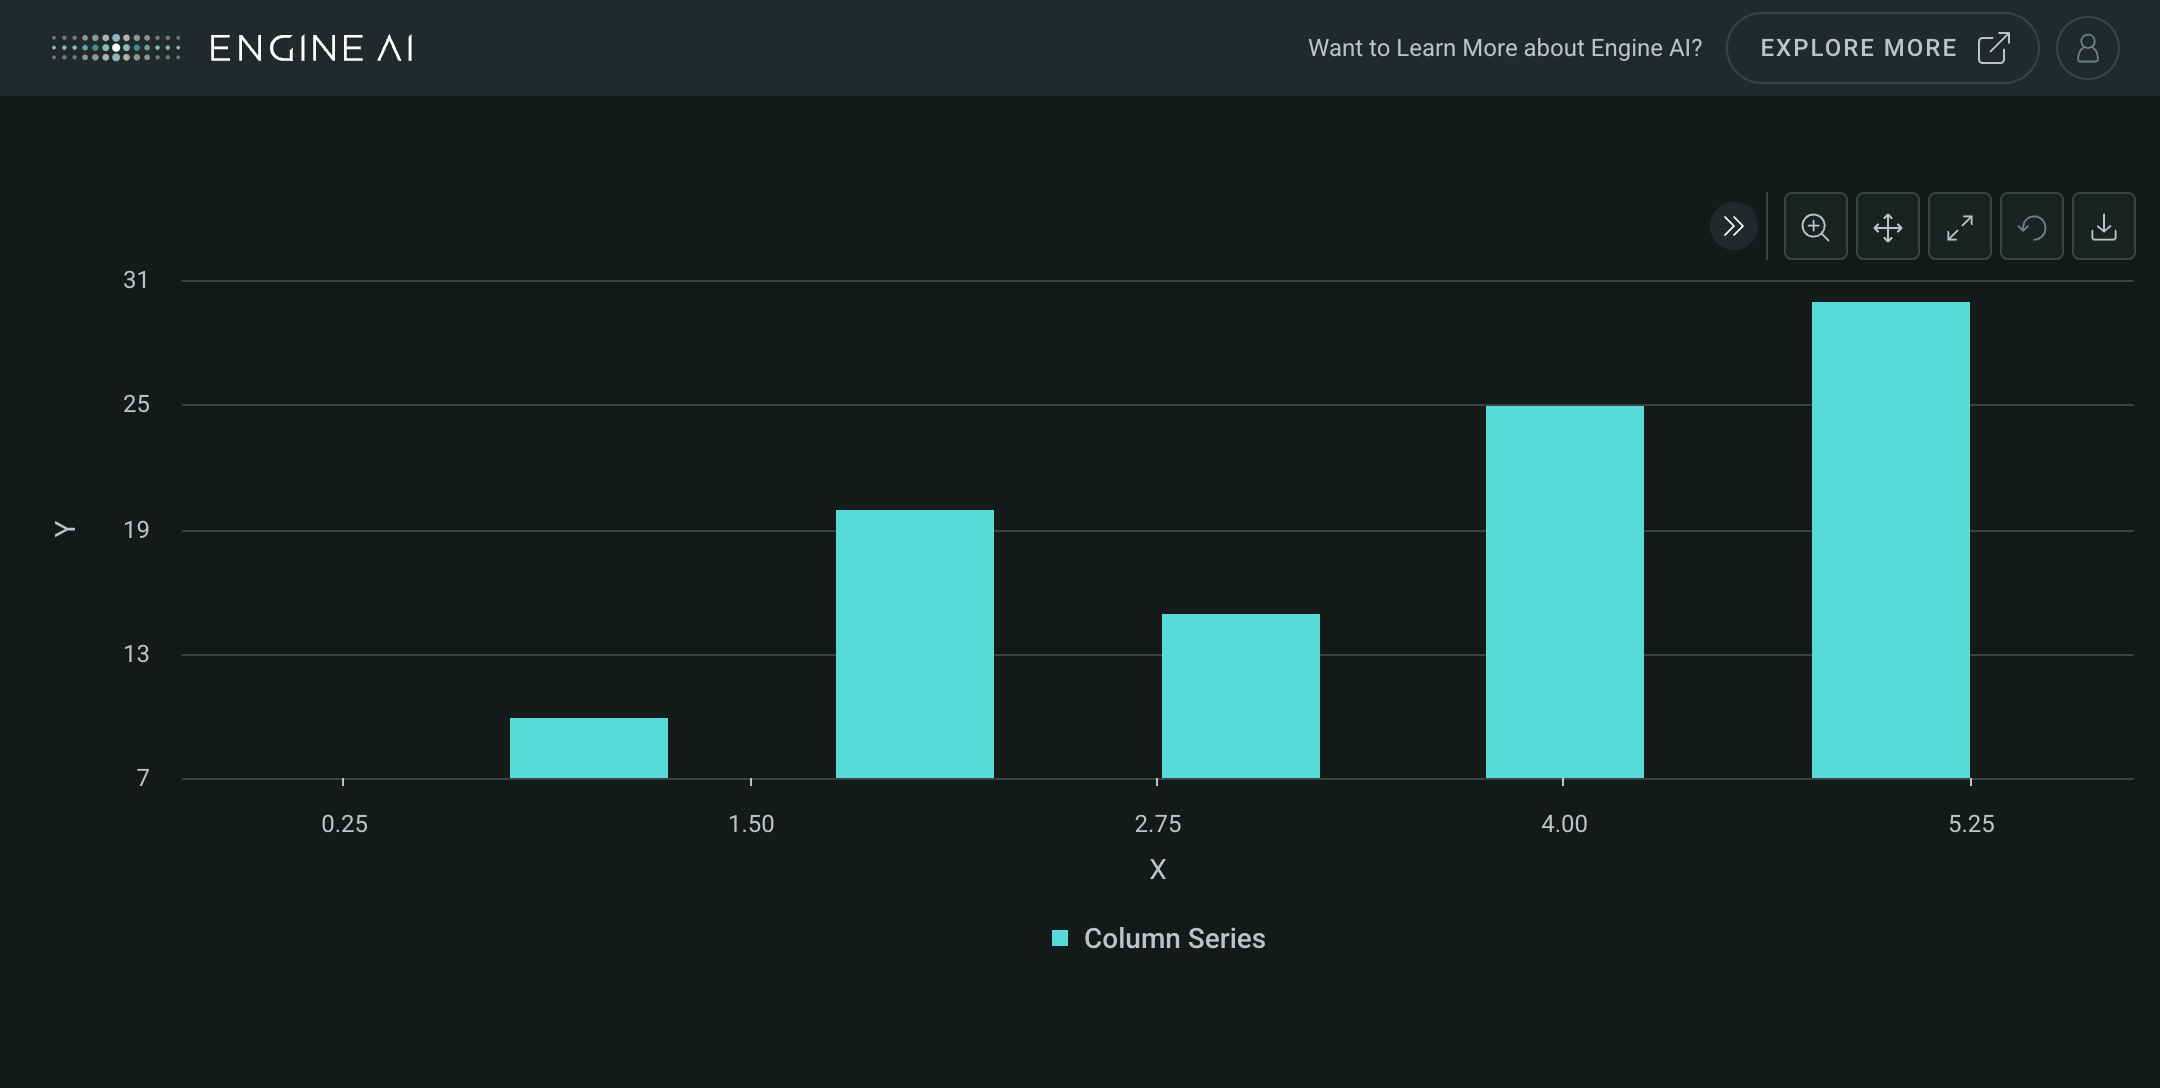
Create a Cartesian widget with ColumnSeries
import pandas as pd

from engineai.sdk.dashboard.dashboard import Dashboard
from engineai.sdk.dashboard.widgets import cartesian

data_column = pd.DataFrame(
    {
        "x1": [1, 2, 3, 4, 5],
        "y1": [10, 20, 15, 25, 30],
    }
)

column_series = cartesian.ColumnSeries(
    data_column="y1",
    name="Column Series",
)

cartesian_widget_column = cartesian.Cartesian(
    data=data_column,
    x_axis="x1",
    left_y_axis=column_series,
)

Dashboard(
    workspace_slug="my-workspace",
    app_slug="my-app",
    slug="first-dashboard",
    content=cartesian_widget_column,
)
LineSeries #
LineSeries(
    *,
    data_column: str | GenericLink,
    x_data_column: str | GenericLink | None = None,
    formatting: NumberFormatting | None = None,
    name: str | GenericLink | None = None,
    styling: Palette | LineSeriesStyling | None = None,
    entity: Entities | None = None,
    show_in_legend: bool = True,
    required: bool = True,
    visible: bool = True,
    point_label_column: str | GenericLink | None = None,
    tooltips: TooltipItems | None = None,
)
Spec for a line series of a Cartesian widget.
Construct line series.
Parameters:
| Name | Type | Description | Default |
|---|---|---|---|
data_column
|
str | GenericLink
|
name of column in pandas dataframe(s) used for the values of this series for the Y Axis. |
required |
x_data_column
|
str | GenericLink | None
|
name of column in pandas dataframe(s) used for the values of this series for the X Axis. This column will override the data column defined in the X Axis instance. |
None
|
formatting
|
NumberFormatting | None
|
formatting spec for value associated with Y Axis. |
None
|
name
|
str | GenericLink | None
|
series name (shown in legend and tooltip). |
None
|
styling
|
Palette | LineSeriesStyling | None
|
styling spec. |
None
|
entity
|
Entities | None
|
entity spec. |
None
|
show_in_legend
|
bool
|
whether to show series in legend or not. |
True
|
required
|
bool
|
Flag to make the Series mandatory. If required == True and no Data the widget will show an error. If required==False and no Data, the widget hides the Series. |
True
|
visible
|
bool
|
Flag to make the Series visible when chart is loaded. |
True
|
point_label_column
|
str | GenericLink | None
|
name of column in dataframe(s) used for label of each point. |
None
|
tooltips
|
TooltipItems | None
|
tooltip items to be displayed at Series level. |
None
|
Examples:#
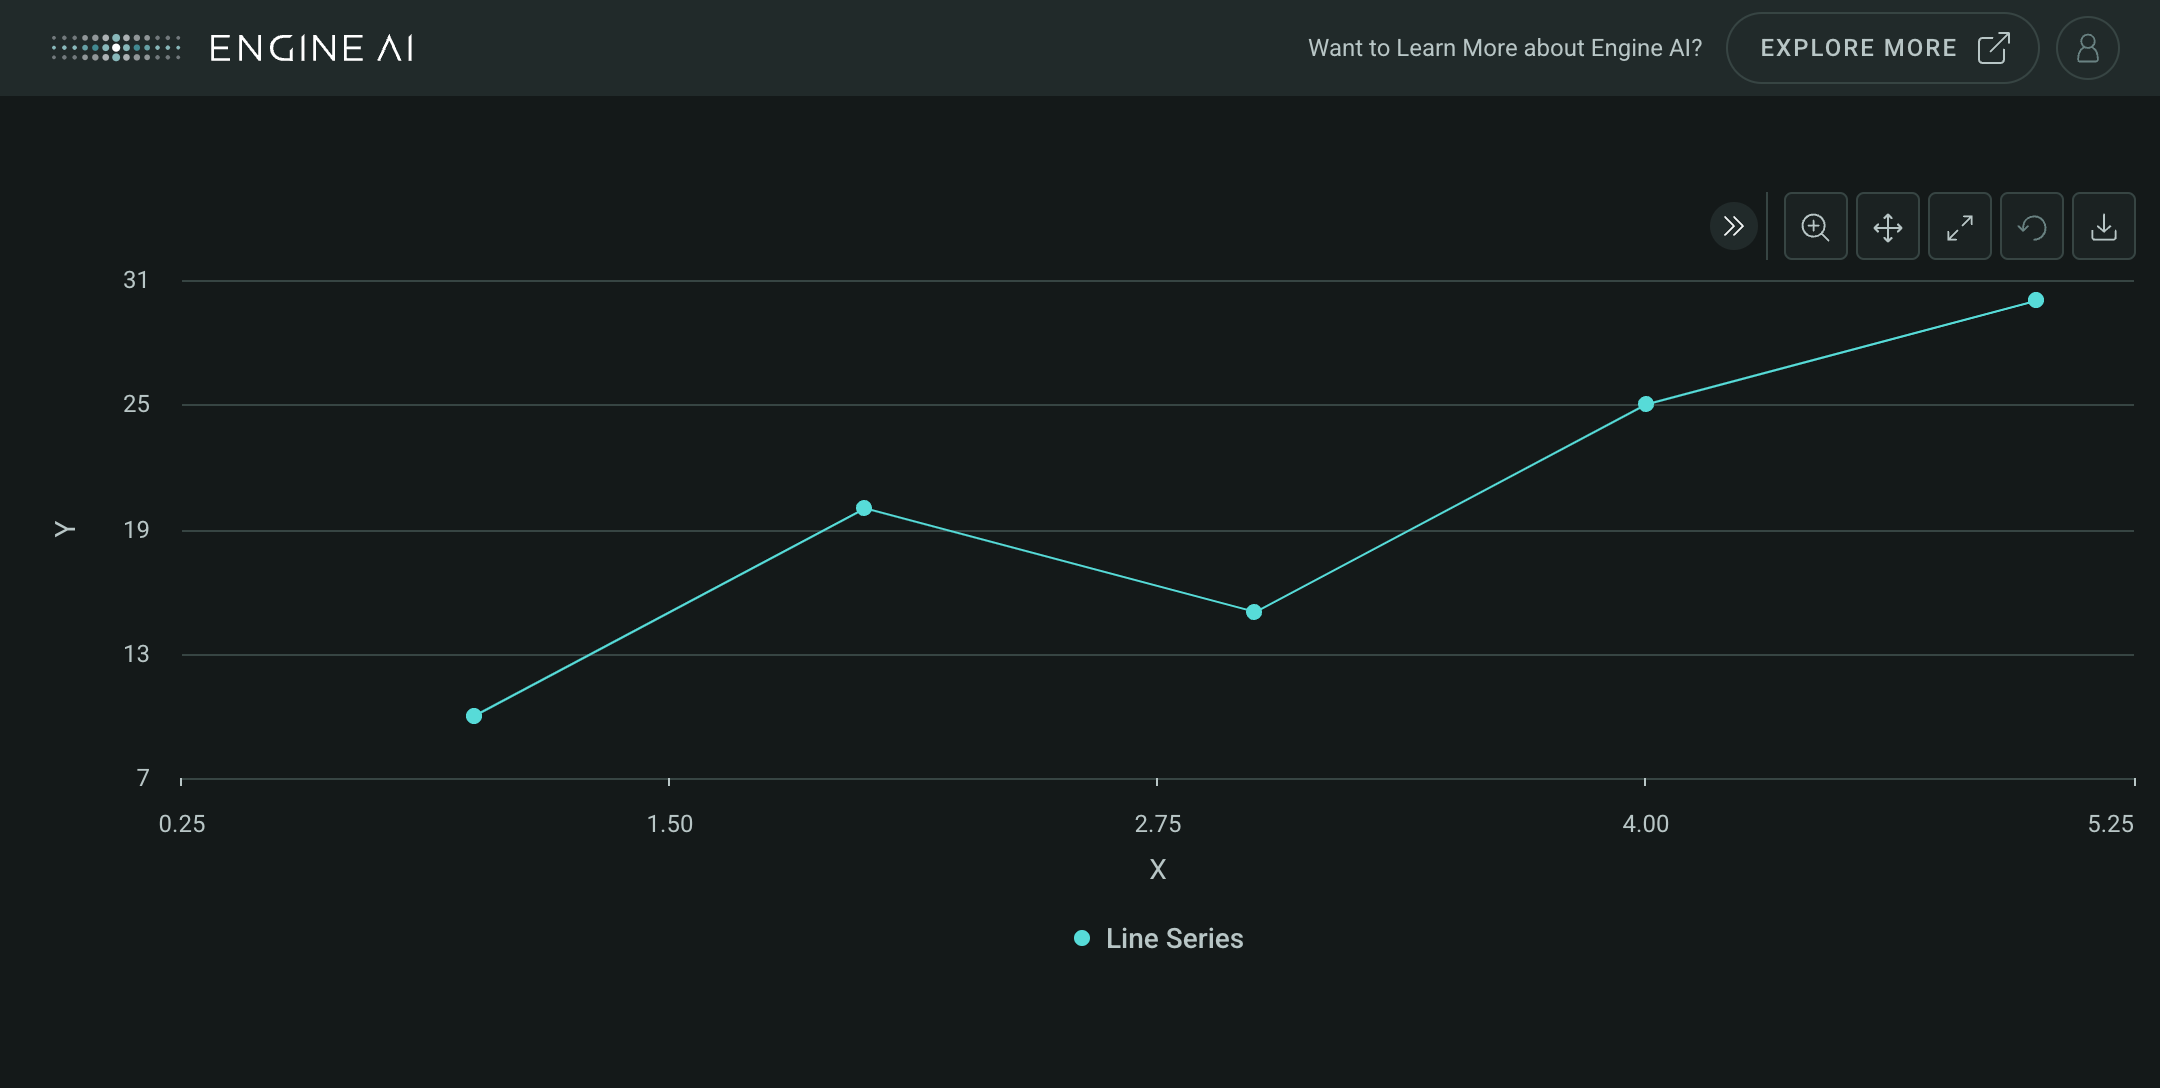
Create a Cartesian widget with LineSeries
import pandas as pd

from engineai.sdk.dashboard.dashboard import Dashboard
from engineai.sdk.dashboard.widgets import cartesian

data_line = pd.DataFrame(
    {
        "x1": [1, 2, 3, 4, 5],
        "y1": [10, 20, 15, 25, 30],
    }
)

line_series = cartesian.LineSeries(
    data_column="y1",
    name="Line Series",
)

cartesian_widget_line = cartesian.Cartesian(
    data=data_line,
    x_axis="x1",
    left_y_axis=line_series,
)

Dashboard(
    workspace_slug="my-workspace",
    app_slug="my-app",
    slug="first-dashboard",
    content=cartesian_widget_line,
)
ScatterSeries #
ScatterSeries(
    *,
    data_column: str | GenericLink,
    x_data_column: str | GenericLink | None = None,
    formatting: NumberFormatting | None = None,
    name: str | GenericLink | None = None,
    entity: Entities | None = None,
    styling: Palette | ScatterSeriesStyling | None = None,
    show_in_legend: bool = True,
    required: bool = True,
    visible: bool = True,
    point_label_column: str | GenericLink | None = None,
    tooltips: TooltipItems | None = None,
)
Spec for a scatter series of a Cartesian widget.
Construct scatter series.
Parameters:
| Name | Type | Description | Default |
|---|---|---|---|
data_column
|
str | GenericLink
|
name of column in pandas dataframe(s) used for the values of this series for the Y Axis. |
required |
x_data_column
|
str | GenericLink | None
|
name of column in pandas dataframe(s) used for the values of this series for the X Axis. This column will override the data column defined in the X Axis instance. |
None
|
formatting
|
NumberFormatting | None
|
formatting spec for value associated with Y Axis. |
None
|
name
|
str | GenericLink | None
|
series name (shown in legend and tooltip). |
None
|
styling
|
Palette | ScatterSeriesStyling | None
|
styling spec. |
None
|
entity
|
Entities | None
|
entity spec. |
None
|
show_in_legend
|
bool
|
whether to show series in legend or not. |
True
|
required
|
bool
|
Flag to make the Series mandatory. If required == True and no Data the widget will show an error. If required==False and no Data, the widget hides the Series. |
True
|
visible
|
bool
|
Flag to make the Series visible when chart is loaded. |
True
|
point_label_column
|
str | GenericLink | None
|
name of column in dataframe(s) used for label of each point. |
None
|
tooltips
|
TooltipItems | None
|
tooltip items to be displayed at Series level. |
None
|
Examples:#
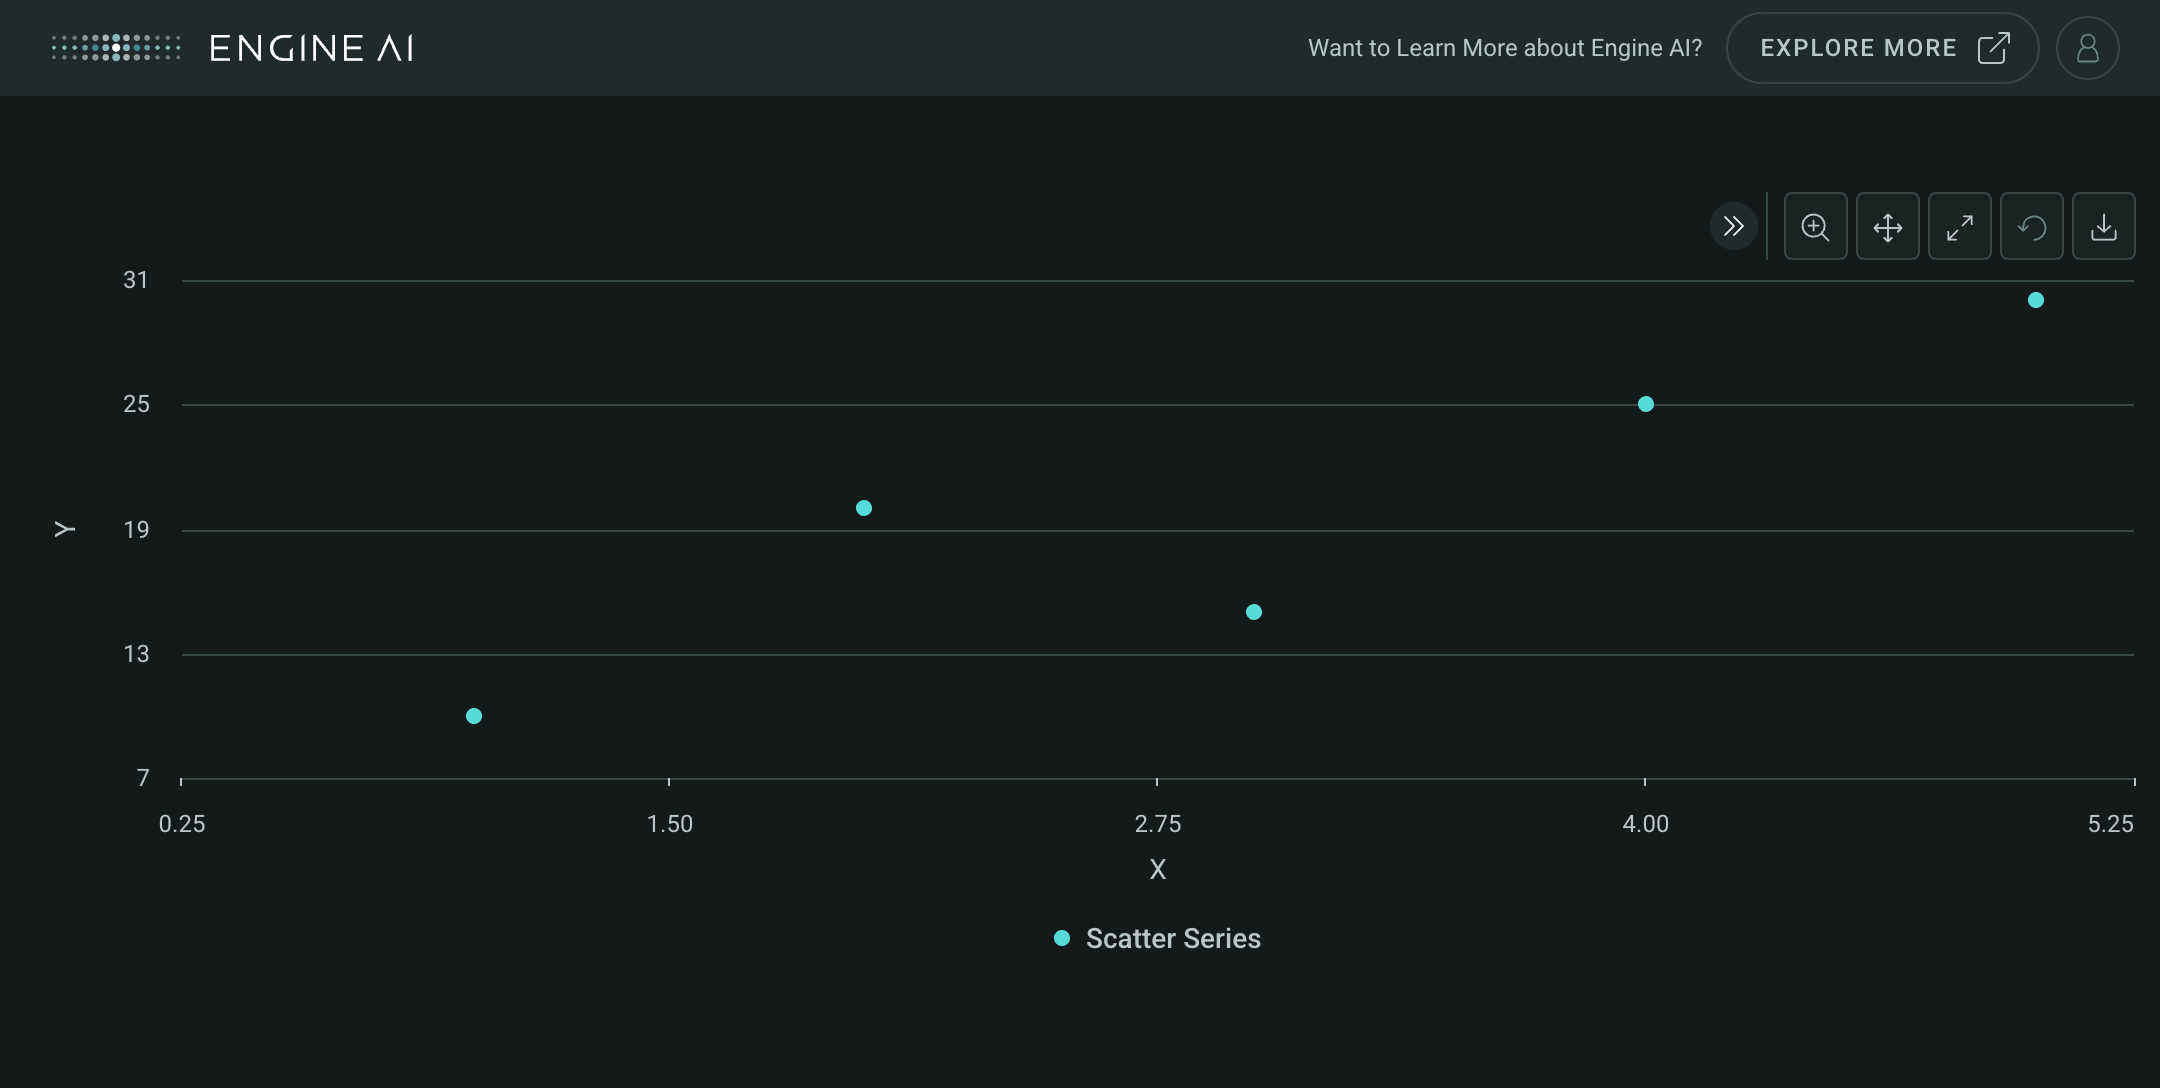
Create a Cartesian widget with ScatterSeries
import pandas as pd

from engineai.sdk.dashboard.dashboard import Dashboard
from engineai.sdk.dashboard.widgets import cartesian

data_scatter = pd.DataFrame(
    {
        "x1": [1, 2, 3, 4, 5],
        "y1": [10, 20, 15, 25, 30],
    }
)

scatter_series = cartesian.ScatterSeries(
    data_column="y1",
    name="Scatter Series",
)

cartesian_widget_scatter = cartesian.Cartesian(
    data=data_scatter,
    x_axis="x1",
    left_y_axis=scatter_series,
)

Dashboard(
    workspace_slug="my-workspace",
    app_slug="my-app",
    slug="first-dashboard",
    content=cartesian_widget_scatter,
)
Types#
BubbleSeriesStyling
module-attribute
#
BubbleSeriesStyling = (
    BubbleCircleSeriesStyling | BubbleCountrySeriesStyling
)
CartesianSeries
module-attribute
#
CartesianSeries = (
    LineSeries
    | AreaSeries
    | AreaRangeSeries
    | ColumnSeries
    | BubbleSeries
    | ScatterSeries
    | CartesianBaseSeries
)
YAxisSeries
module-attribute
#
YAxisSeries = (
    str
    | list[str]
    | WidgetField
    | list[WidgetField]
    | CartesianSeries
    | list[CartesianSeries]
)