Geo#
Geo #
Geo(
    data: DataType | StaticDataType,
    *,
    series: MapSeries | None = None,
    region_column: str = "region",
    color_axis: ColorAxis | None = None,
    widget_id: str | None = None,
    title: WidgetTitleType | None = None,
    legend_position: LegendPosition = BOTTOM,
    styling: MapStyling | None = None,
    region: Region = WORLD,
    tooltips: TooltipItems | None = None,
)
Widget for tailored geographic data visualization.
Allows the construction of a widget specifically tailored for geographical data visualization.
Constructor for Map Geo widget.
Parameters:
| Name | Type | Description | Default |
|---|---|---|---|
data
|
DataType | StaticDataType
|
data source for the widget. |
required |
series
|
MapSeries | None
|
Series to be added to y axis. |
None
|
region_column
|
str
|
key to match region code in DS. |
'region'
|
widget_id
|
str | None
|
unique widget id in a dashboard. |
None
|
color_axis
|
ColorAxis | None
|
color axis spec. |
None
|
title
|
WidgetTitleType | None
|
title of widget can be either a string (fixed value) or determined by a value from another widget using a WidgetField. |
None
|
legend_position
|
LegendPosition
|
location of position relative to data, maps. |
BOTTOM
|
styling
|
MapStyling | None
|
styling for the map. |
None
|
region
|
Region
|
sets the region os the Map. |
WORLD
|
tooltips
|
TooltipItems | None
|
tooltip items to be displayed at Chart level. |
None
|
Examples:#
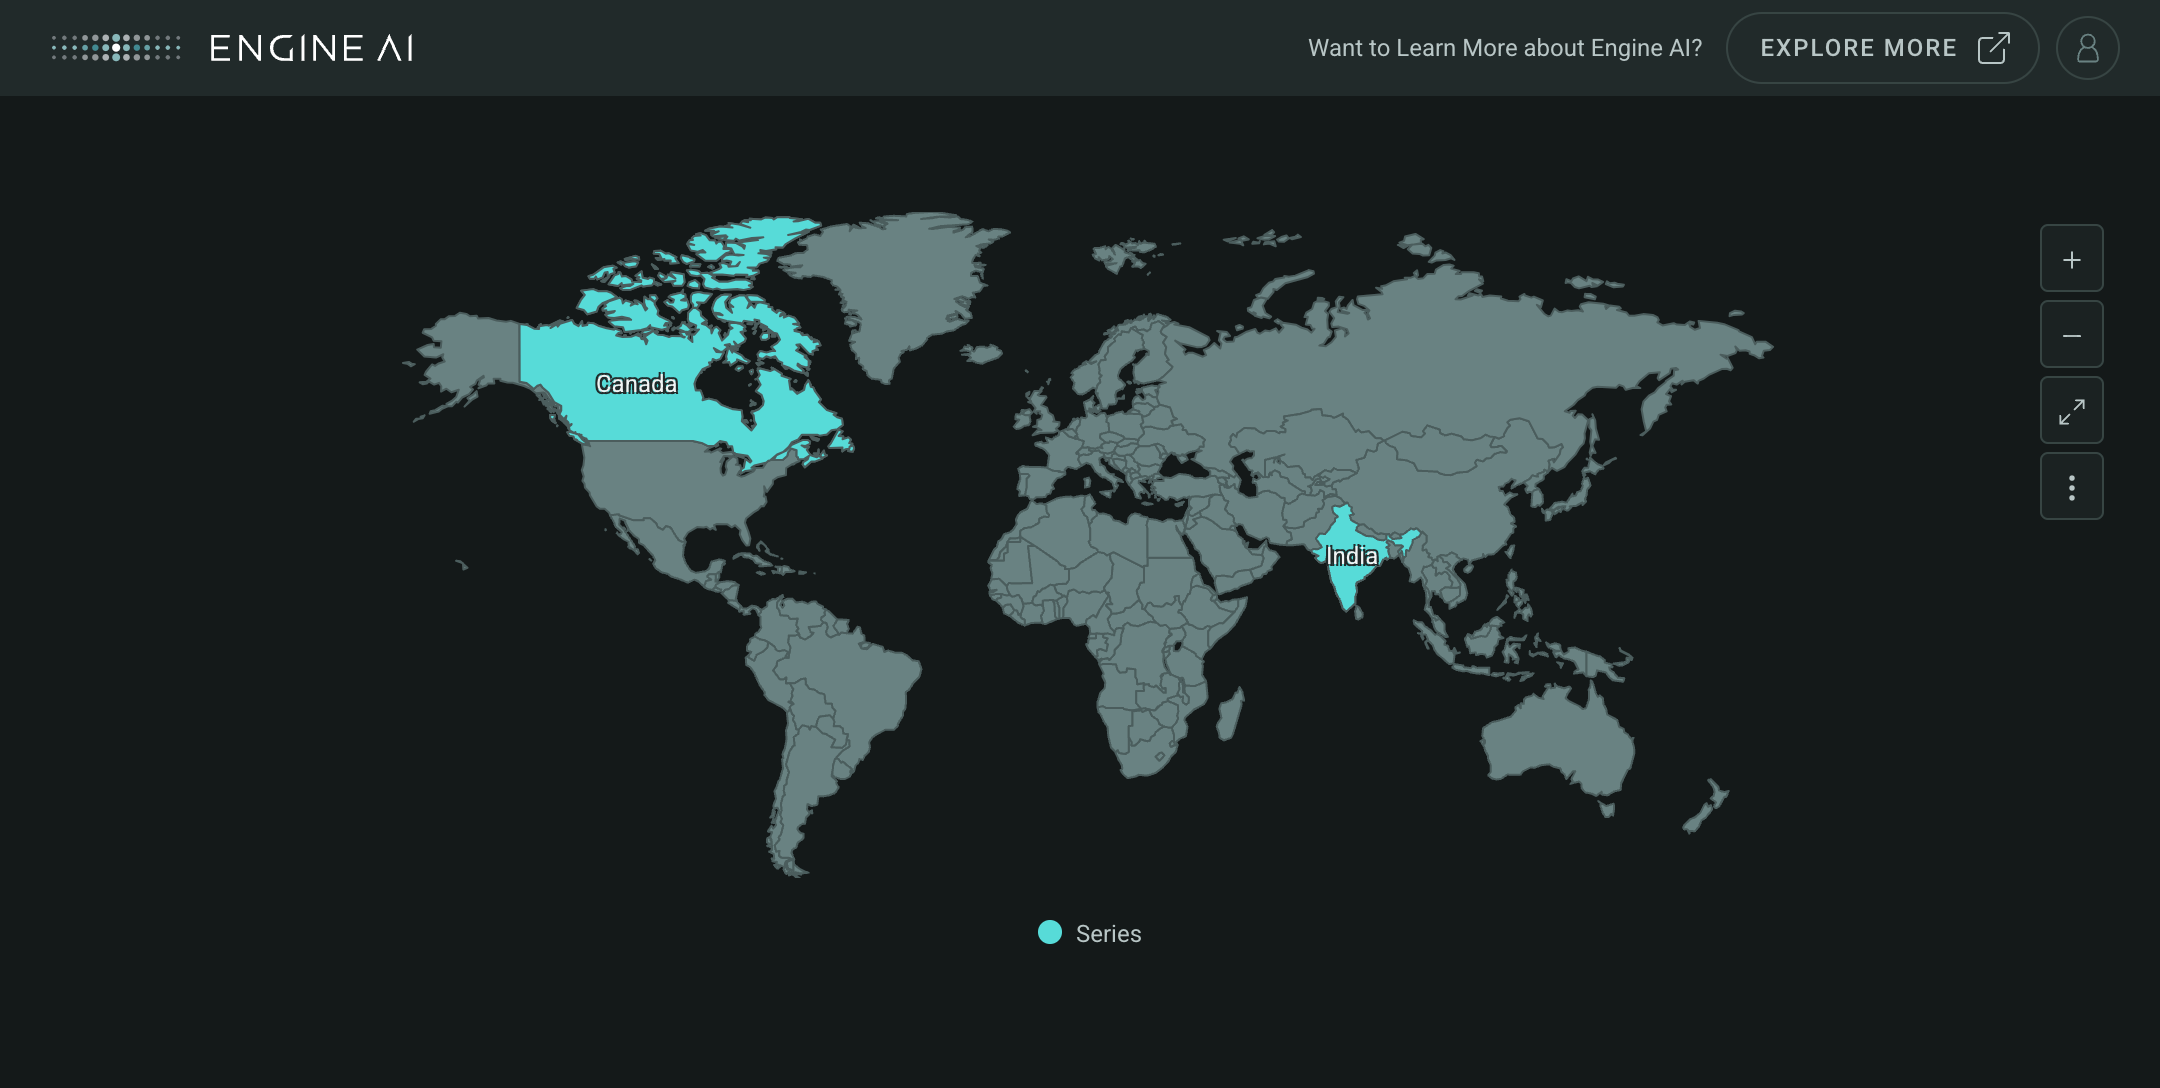
Create a minimal Geo widget
import pandas as pd

from engineai.sdk.dashboard.dashboard import Dashboard
from engineai.sdk.dashboard.widgets import maps

data = pd.DataFrame(
    data=[
        {"region": "CA", "value": 1},
        {"region": "IN", "value": 2},
    ]
)

map_widget = maps.Geo(
  data=data,
  region_column="region",
)

Dashboard(
    workspace_slug="my-workspace",
    app_slug="my-app",
    slug="first-dashboard",
    content=map_widget,
)
Data#
This widget works with tabular data, typically in the form of a Pandas DataFrame.
Components#
NumericSeries #
NumericSeries(
    *,
    data_column: TemplatedStringItem = "value",
    name: TemplatedStringItem | None = None,
    formatting: NumberFormatting | None = None,
    styling: Palette | SeriesStyling | None = None,
    required: bool = True,
    tooltips: TooltipItems | None = None,
)
Spec for a numeric series of a Map widget.
Constructor for NumericSeries.
Parameters:
| Name | Type | Description | Default |
|---|---|---|---|
data_column
|
TemplatedStringItem
|
data column to match field in DataStore. |
'value'
|
name
|
TemplatedStringItem | None
|
series name (shown in legend and tooltip). |
None
|
formatting
|
NumberFormatting | None
|
formatting spec for value. |
None
|
styling
|
Palette | SeriesStyling | None
|
styling spec. |
None
|
required
|
bool
|
Flag to make the Series mandatory. If required == True and no Data the widget will show an error. If required==False and no Data, the widget hides the Series. |
True
|
tooltips
|
TooltipItems | None
|
tooltip items to be displayed at Series level. |
None
|
SeriesStyling #
SeriesStyling(
    *,
    color_spec: ColorSpec | None = None,
    data_column: str | None = None,
)
Style numeric series appearance on map.
Style the appearance of numeric series on a map, including color specifications and data column mapping for gradients or discrete maps.
Constructor for SeriesStyling.
Parameters:
| Name | Type | Description | Default |
|---|---|---|---|
color_spec
|
ColorSpec | None
|
spec for coloring area |
None
|
data_column
|
str | None
|
name of column in pandas dataframe(s) used for color spec if a gradient is used. Optional for single colors. |
None
|
Raises:
| Type | Description |
|---|---|
ValueError
|
if data_column is set and color_spec is Single. |
MapStyling #
MapStyling(*, label: MapStylingLabel | None = None)
Spec for MapStyling of a Map Geo widget.
Construct a Styling for a Map Geo widget.
Parameters:
| Name | Type | Description | Default |
|---|---|---|---|
label
|
MapStylingLabel | None
|
label style for map |
None
|
MapStylingLabel #
Spec for Map Geo Styling Label of a Map widget.
Construct a Styling Label for a Map Geo widget.
Parameters:
| Name | Type | Description | Default |
|---|---|---|---|
hidden
|
bool
|
Hide labels. |
False
|
ColorAxis #
ColorAxis(
    *,
    position: LegendPosition = BOTTOM,
    formatting: NumberFormatting | None = None,
)
Spec for ColorAxis of a Map widget.
Construct a ColorAxis for a Map Shape widget.
Parameters:
| Name | Type | Description | Default |
|---|---|---|---|
position
|
LegendPosition
|
location of position relative to data, maps. |
BOTTOM
|
formatting
|
NumberFormatting | None
|
formatting spec for value. |
None
|
Enums#
LegendPosition #
Legend positioning options on map.
Options for positioning the legend on the map, including top, left, right, and bottom.
Attributes:
| Name | Type | Description |
|---|---|---|
TOP |
Legend is placed on the top of the map. |
|
LEFT |
Legend is placed on the left side of the map. |
|
RIGHT |
Legend is placed on the right side of the map. |
|
BOTTOM |
Legend is placed on the bottom of the map. |
Region #
Region options for map.
Options for defining the region of the map, such as world, Europe, USA, and North America.
Attributes:
| Name | Type | Description |
|---|---|---|
WORLD |
World region. |
|
EUROPE |
Europe region. |
|
USA |
USA region. |
|
NORTH_AMERICA |
North America region. |
|
SAUDI_ARABIA |
Saudi Arabia region. |