Categorical#
Categorical #
Categorical(
    data: DataType | DataFrame,
    *,
    category_axis: str
    | WidgetField
    | CategoryAxis = "category",
    value_axis: ValueAxisSeries | ValueAxis | None = None,
    secondary_value_axis: ValueAxisSeries
    | ValueAxis
    | None = None,
    widget_id: str | None = None,
    legend_position: LegendPosition = BOTTOM,
    title: WidgetTitleType | None = None,
    enable_toolbar: bool = True,
    direction: ChartDirection = VERTICAL,
    tooltips: list[TooltipItem] | None = None,
)
Spec for Categorical widget.
Construct spec for a Categorical widget.
Parameters:
| Name | Type | Description | Default |
|---|---|---|---|
data
|
DataType | DataFrame
|
data source for the widget. |
required |
widget_id
|
str | None
|
unique widget id in a dashboard. |
None
|
category_axis
|
str | WidgetField | CategoryAxis
|
spec for category axis. |
'category'
|
value_axis
|
ValueAxisSeries | ValueAxis | None
|
spec for main value axis. |
None
|
secondary_value_axis
|
ValueAxisSeries | ValueAxis | None
|
Spec for secondary value axis. |
None
|
legend_position
|
LegendPosition
|
legend of Categorical widget. |
BOTTOM
|
title
|
WidgetTitleType | None
|
title of widget can be either a string (fixed value) or determined by a value from another widget using a WidgetField. |
None
|
enable_toolbar
|
bool
|
Enable/Disable toolbar flag. |
True
|
direction
|
ChartDirection
|
option to set the direction for series in the Chart. |
VERTICAL
|
tooltips
|
list[TooltipItem] | None
|
list of tooltip items. |
None
|
Examples:#
Create a minimal Categorical widget
import pandas as pd

from engineai.sdk.dashboard.dashboard import Dashboard
from engineai.sdk.dashboard.widgets import categorical

data = pd.DataFrame(
    [
        {"category": "Apple", "value": 100, "value_2": 1999},
        {"category": "Microsoft", "value": 200, "value_2": 2999},
    ]
)

categorical_widget = categorical.Categorical(
    data=data,
    category_axis="category",
)

Dashboard(
    workspace_slug="my-workspace",
    app_slug="my-app",
    slug="first-dashboard",
    content=categorical_widget,
)
Data#
This widget works with tabular data, typically in the form of a Pandas DataFrame.
Components#
CategoryAxis #
CategoryAxis(
    *,
    data_column: str | GenericLink,
    label_column: str | GenericLink | None = None,
    title: str | GenericLink = "",
    enable_crosshair: bool = False,
    line: AxisLine | None = None,
    band: AxisBand | None = None,
)
Specs for category axis of a Categorical chart.
Construct category axis for a Categorical chart.
Parameters:
| Name | Type | Description | Default |
|---|---|---|---|
title
|
str | GenericLink
|
axis title. |
''
|
data_column
|
str | GenericLink
|
name of column in pandas dataframe(s) used for Category axis values. |
required |
enable_crosshair
|
bool
|
whether to enable crosshair that follows either the mouse pointer or the hovered point. |
False
|
label_column
|
str | GenericLink | None
|
name of column in pandas dataframe(s) used for the label of each category. Same values are used for each series. |
None
|
line
|
AxisLine | None
|
specs for chart axis line. |
None
|
band
|
AxisBand | None
|
specs for chart axis band. |
None
|
ValueAxis #
ValueAxis(
    *,
    series: ValueAxisSeries,
    formatting: AxisNumberFormatting | None = None,
    title: str | GenericLink | None = None,
    enable_crosshair: bool = False,
    scale: AxisScale | None = None,
    line: AxisLine | None = None,
    band: AxisBand | None = None,
)
Specs for Value Axis of a Categorical chart.
Construct Value Axis for a Categorical chart.
Parameters:
| Name | Type | Description | Default |
|---|---|---|---|
series
|
ValueAxisSeries
|
series to be added to the axis. |
required |
formatting
|
AxisNumberFormatting | None
|
formatting spec for axis labels. |
None
|
title
|
str | GenericLink | None
|
axis title. |
None
|
scale
|
AxisScale | None
|
y axis scale, one of AxisScaleDynamic, AxisScaleSymmetric, AxisScalePositive, AxisScaleNegative. |
None
|
enable_crosshair
|
bool
|
whether to enable crosshair that follows either the mouse pointer or the hovered point. Defaults to False. |
False
|
line
|
AxisLine | None
|
line to be added to the axis. |
None
|
band
|
AxisBand | None
|
band to be added to the axis. |
None
|
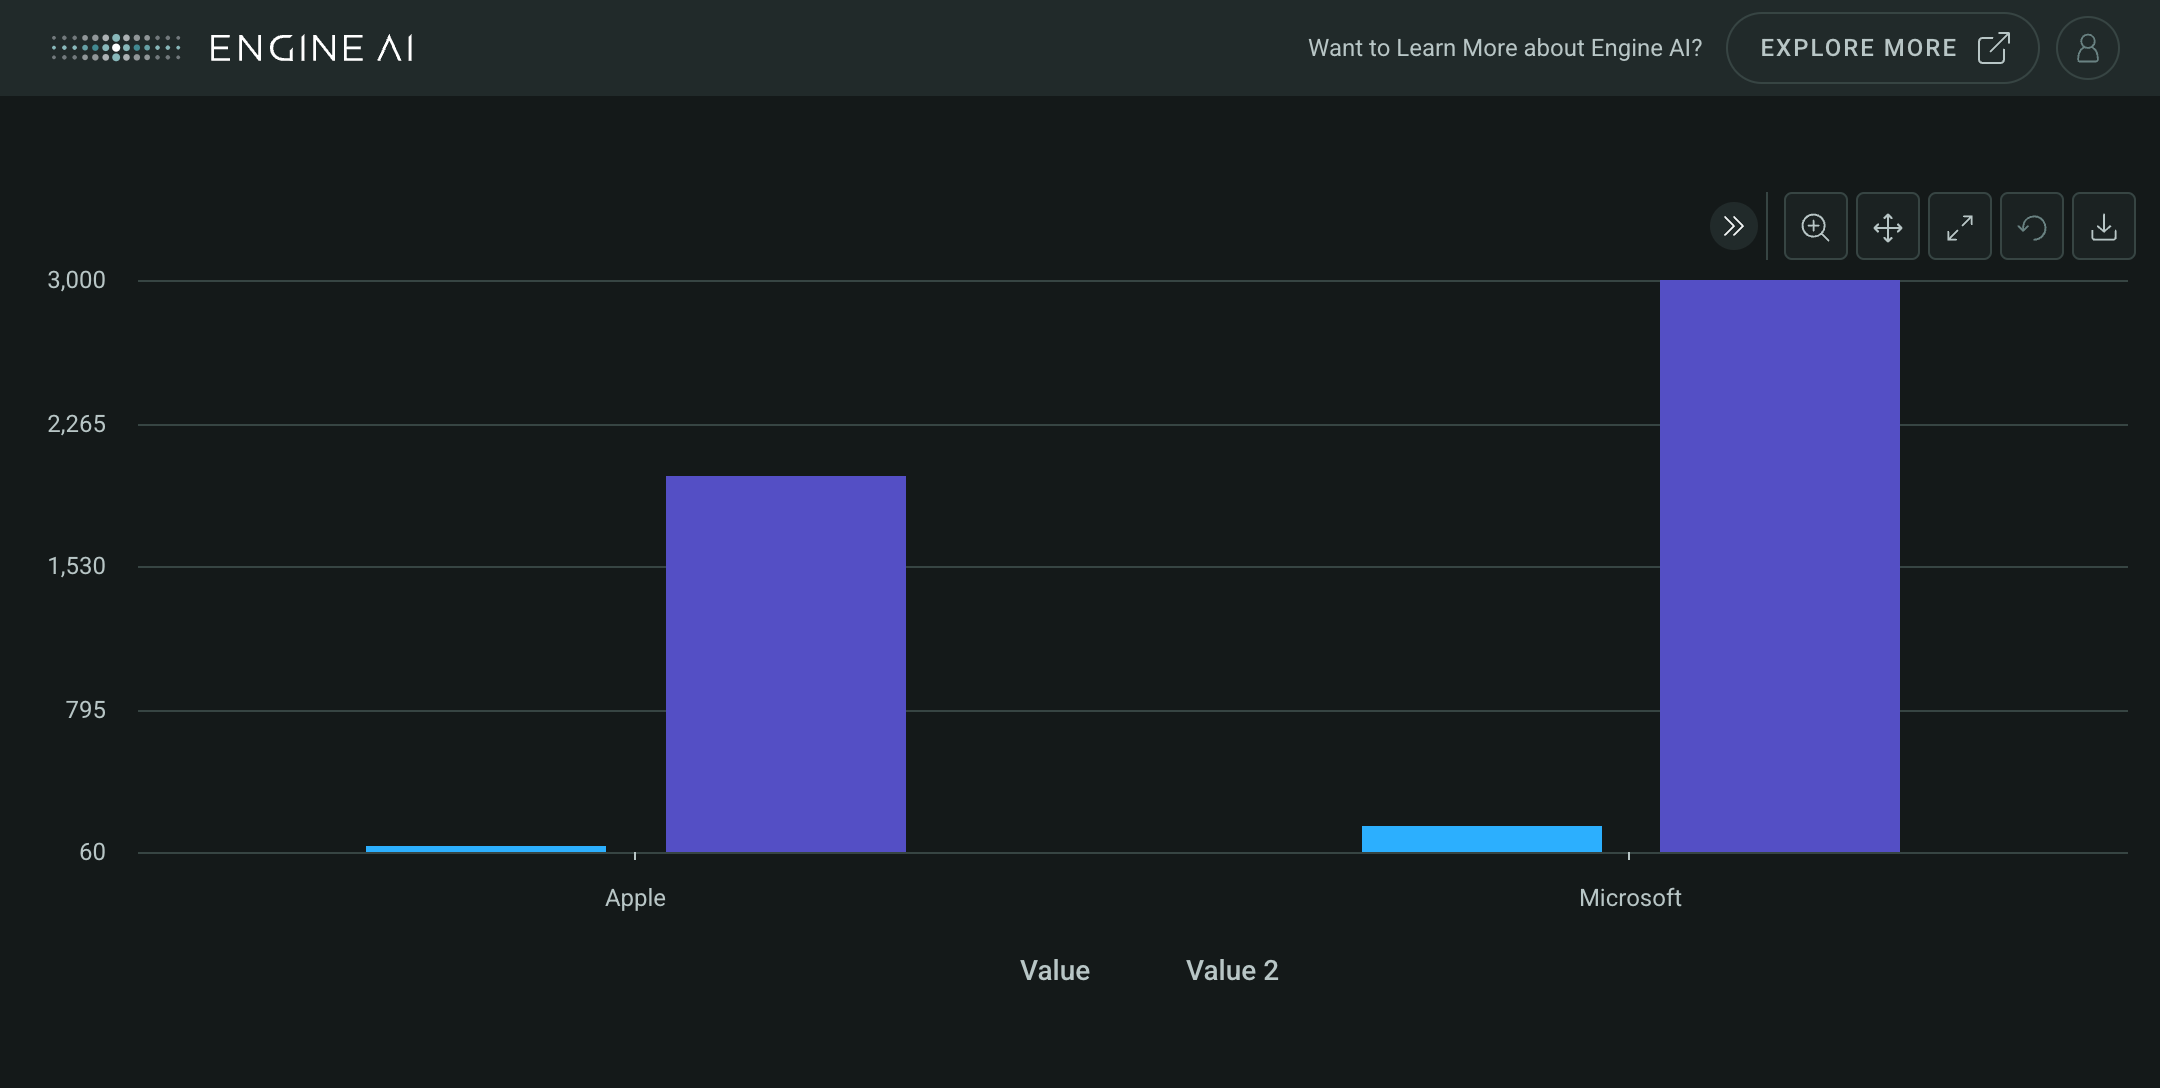
Create a Categorical widget with two ValueAxis
import pandas as pd

from engineai.sdk.dashboard.dashboard import Dashboard
from engineai.sdk.dashboard.styling.color import Palette
from engineai.sdk.dashboard.widgets import categorical
from engineai.sdk.dashboard.widgets.components.charts.styling import (
    BubbleCircleSeriesStyling,
    ColumnSeriesStyling,
    PointSeriesStyling,
)

data = pd.DataFrame(
    [
        {
            "company": "Apple",
            "shares_short": 700,
            "volume": 1200,
            "market_cap": 1500,
        },
        {
            "company": "Microsoft",
            "shares_short": 900,
            "volume": 1600,
            "market_cap": 2000,
        },
    ]
)

categorical_widget = categorical.Categorical(
    data=data,
    category_axis="company",
    value_axis=categorical.ValueAxis(
        series=[
            categorical.PointSeries(
                data_column="volume",
                styling=PointSeriesStyling(color_spec=Palette.PURPLE_7),
            ),
            categorical.ColumnSeries(
                data_column="shares_short",
                styling=ColumnSeriesStyling(color_spec=Palette.SKY_BLUE),
            ),
        ]
    ),
    secondary_value_axis=categorical.ValueAxis(
        series=categorical.BubbleSeries(
            name="Market Cap vs Volume",
            data_column="volume",
            bubble_size_data_column="market_cap",
            bubble_name="Market Cap",
            styling=BubbleCircleSeriesStyling(color_spec=Palette.GOLD_5),
        )
    ),
)

Dashboard(
    workspace_slug="my-workspace",
    app_slug="my-app",
    slug="first-dashboard",
    content=categorical_widget,
)

LegendPosition #
Chart legend position options.
Options for positions of charts legend.
Attributes:
| Name | Type | Description |
|---|---|---|
RIGHT |
str
|
Legend is placed to the right of the chart. |
BOTTOM |
str
|
Legend is placed below the chart. |
RIGHT_GROUPED |
str
|
Legend is placed to the right of the chart and grouped with other legends. |
BOTTOM_GROUPED |
str
|
Legend is placed below the chart and grouped with other legends. |
NEXT_TO_DATA |
str
|
Legend is placed next to the data. |
ChartDirection #
Options for directions of categorical chart.
Attributes:
| Name | Type | Description |
|---|---|---|
VERTICAL |
Chart with a vertical direction. |
|
HORIZONTAL |
Chart with a horizontal direction. |
Series#
AreaSeries #
AreaSeries(
    *,
    data_column: str | GenericLink,
    name: str | GenericLink | None = None,
    styling: Palette | AreaSeriesStyling | None = None,
    stacked: bool = False,
    show_in_legend: bool = True,
    required: bool = True,
    visible: bool = True,
    tooltips: list[TooltipItem] | None = None,
)
Spec for a Area Series of a Categorical widget.
Construct Area Series.
Parameters:
| Name | Type | Description | Default |
|---|---|---|---|
data_column
|
str | GenericLink
|
name of column in pandas dataframe(s) used for the values of this series for the Y Axis. |
required |
name
|
str | GenericLink | None
|
series name (shown in legend and tooltip). |
None
|
styling
|
Palette | AreaSeriesStyling | None
|
styling spec. |
None
|
stacked
|
bool
|
whether area is stacked or not. |
False
|
show_in_legend
|
bool
|
whether to show series in legend or not. |
True
|
required
|
bool
|
Flag to make the Series mandatory. If required == True and no Data the widget will show an error. If required==False and no Data, the widget hides the Series. |
True
|
visible
|
bool
|
Flag to make the Series visible when chart is loaded. |
True
|
tooltips
|
list[TooltipItem] | None
|
Tooltip items to show in the tooltip. |
None
|
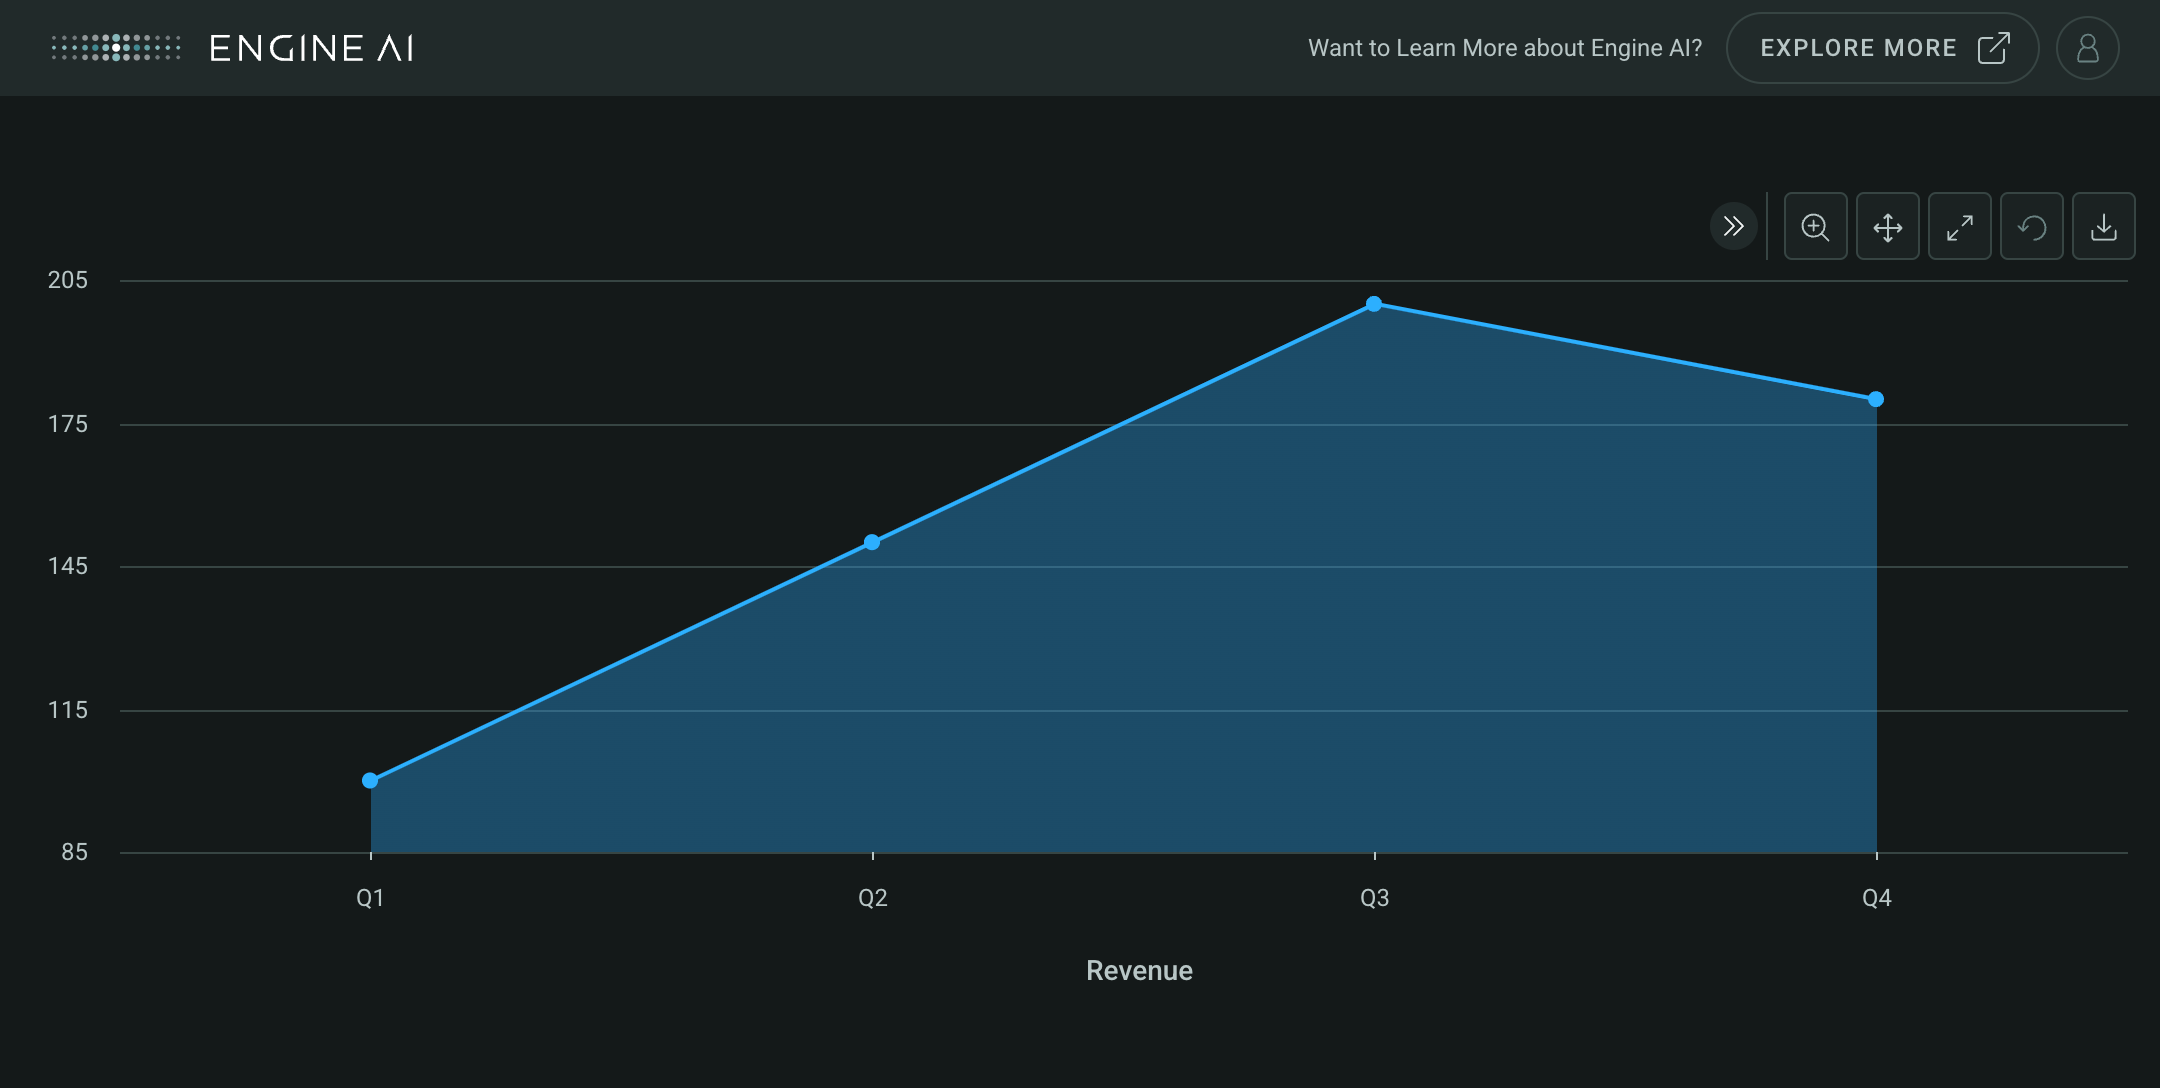
Create a Categorical widget with AreaSeries
import pandas as pd

from engineai.sdk.dashboard.dashboard import Dashboard
from engineai.sdk.dashboard.widgets import categorical

data_area = pd.DataFrame(
    {
        "category": ["Q1", "Q2", "Q3", "Q4"],
        "revenue": [100, 150, 200, 180],
    }
)

area_series = categorical.AreaSeries(
    data_column="revenue",
    name="Revenue",
)

categorical_widget_area = categorical.Categorical(
    data=data_area,
    category_axis="category",
    value_axis=area_series,
)

Dashboard(
    workspace_slug="my-workspace",
    app_slug="my-app",
    slug="first-dashboard",
    content=categorical_widget_area,
)
AreaRangeSeries #
AreaRangeSeries(
    *,
    low_data_column: str | GenericLink,
    high_data_column: str | GenericLink,
    name: str | GenericLink,
    styling: Palette | AreaRangeSeriesStyling | None = None,
    show_in_legend: bool = True,
    required: bool = True,
    visible: bool = True,
    tooltips: list[TooltipItem] | None = None,
)
Spec for a Area Range Series of a Categorical widget.
Construct Area Range Series.
Parameters:
| Name | Type | Description | Default |
|---|---|---|---|
low_data_column
|
str | GenericLink
|
name of column in pandas dataframe(s) used for the low values of this series. |
required |
high_data_column
|
str | GenericLink
|
name of column in pandas dataframe(s) used for the high values of this series. |
required |
name
|
str | GenericLink
|
series name (shown in legend and tooltip). |
required |
styling
|
Palette | AreaRangeSeriesStyling | None
|
styling spec. |
None
|
show_in_legend
|
bool
|
whether to show series in legend or not. |
True
|
required
|
bool
|
Flag to make the Series mandatory. If required == True and no Data the widget will show an error. If required==False and no Data, the widget hides the Series. |
True
|
visible
|
bool
|
Flag to make the Series visible when chart is loaded. |
True
|
tooltips
|
list[TooltipItem] | None
|
Tooltip items to show in the tooltip. |
None
|
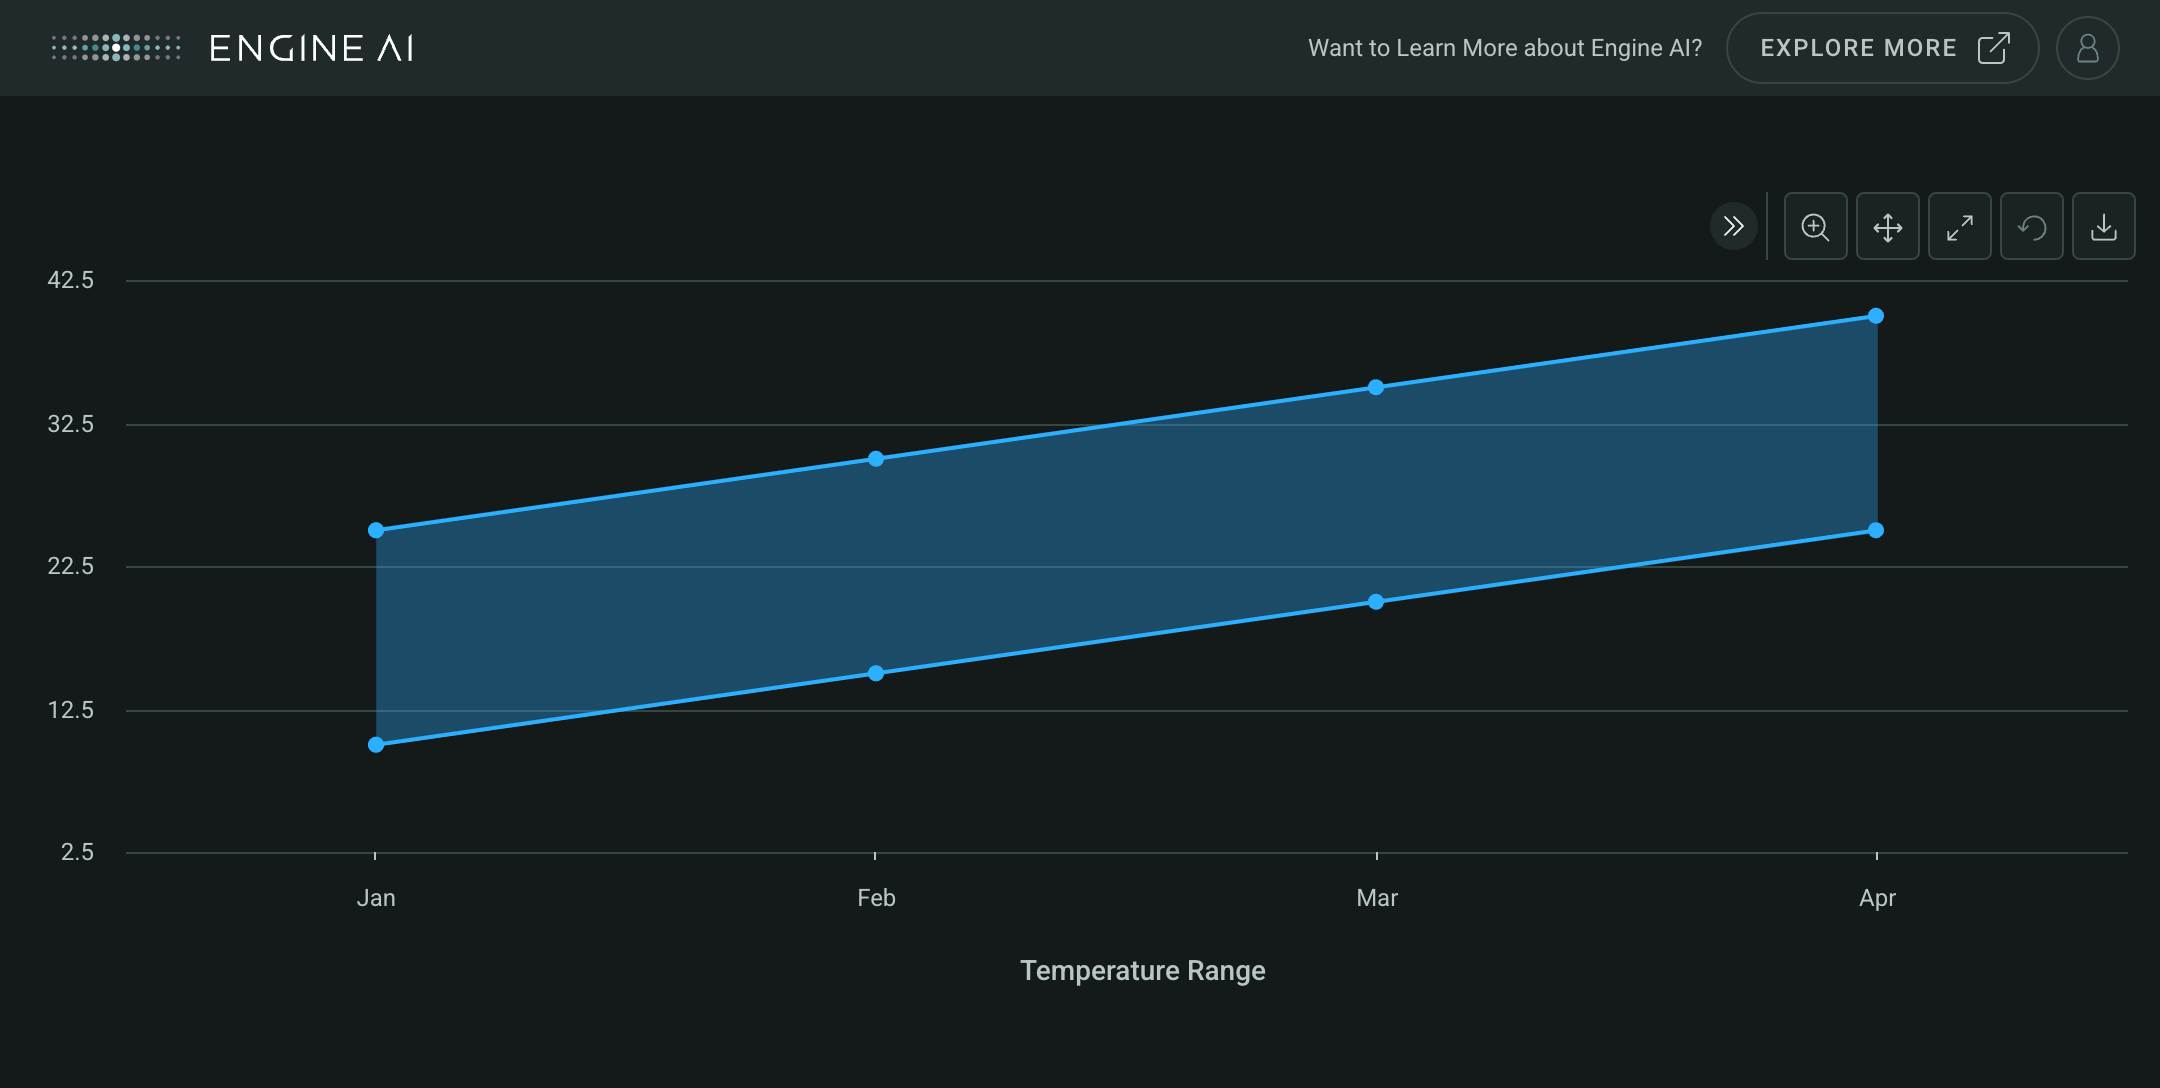
Create a Categorical widget with AreaRangeSeries
import pandas as pd

from engineai.sdk.dashboard.dashboard import Dashboard
from engineai.sdk.dashboard.widgets import categorical

data_area_range = pd.DataFrame(
    {
        "category": ["Jan", "Feb", "Mar", "Apr"],
        "low_temp": [10, 15, 20, 25],
        "high_temp": [25, 30, 35, 40],
    }
)

area_range_series = categorical.AreaRangeSeries(
    low_data_column="low_temp",
    high_data_column="high_temp",
    name="Temperature Range",
)

categorical_widget_area_range = categorical.Categorical(
    data=data_area_range,
    category_axis="category",
    value_axis=area_range_series,
)

Dashboard(
    workspace_slug="my-workspace",
    app_slug="my-app",
    slug="first-dashboard",
    content=categorical_widget_area_range,
)
BubbleSeries #
BubbleSeries(
    *,
    bubble_size_data_column: str | GenericLink,
    data_column: str | GenericLink,
    name: str | GenericLink | None = None,
    bubble_name: str | GenericLink | None = None,
    bubble_size_formatting: NumberFormatting | None = None,
    styling: Palette | BubbleSeriesStyling | None = None,
    show_in_legend: bool = True,
    required: bool = True,
    visible: bool = True,
    tooltips: list[TooltipItem] | None = None,
)
Spec for a Bubble Series of a Categorical widget.
Construct a Bubble Series.
Parameters:
| Name | Type | Description | Default |
|---|---|---|---|
bubble_size_data_column
|
str | GenericLink
|
name of column in pandas dataframe(s) used for the values of this series associated with the size of the bubble. |
required |
data_column
|
str | GenericLink
|
name of column in pandas dataframe(s) used for the values of this series for the Y Axis. |
required |
name
|
str | GenericLink | None
|
series name (shown in legend and tooltip). |
None
|
bubble_name
|
str | GenericLink | None
|
name for the bubble value (show in tooltip). |
None
|
bubble_size_formatting
|
NumberFormatting | None
|
formatting spec for size of the bubble (used in tooltip). |
None
|
styling
|
Palette | BubbleSeriesStyling | None
|
styling spec. |
None
|
show_in_legend
|
bool
|
whether to show series in legend or not. |
True
|
required
|
bool
|
Flag to make the Series mandatory. If required == True and no Data the widget will show an error. If required==False and no Data, the widget hides the Series. |
True
|
visible
|
bool
|
Flag to make the Series visible when chart is loaded. |
True
|
tooltips
|
list[TooltipItem] | None
|
Tooltip items to show in the tooltip. |
None
|
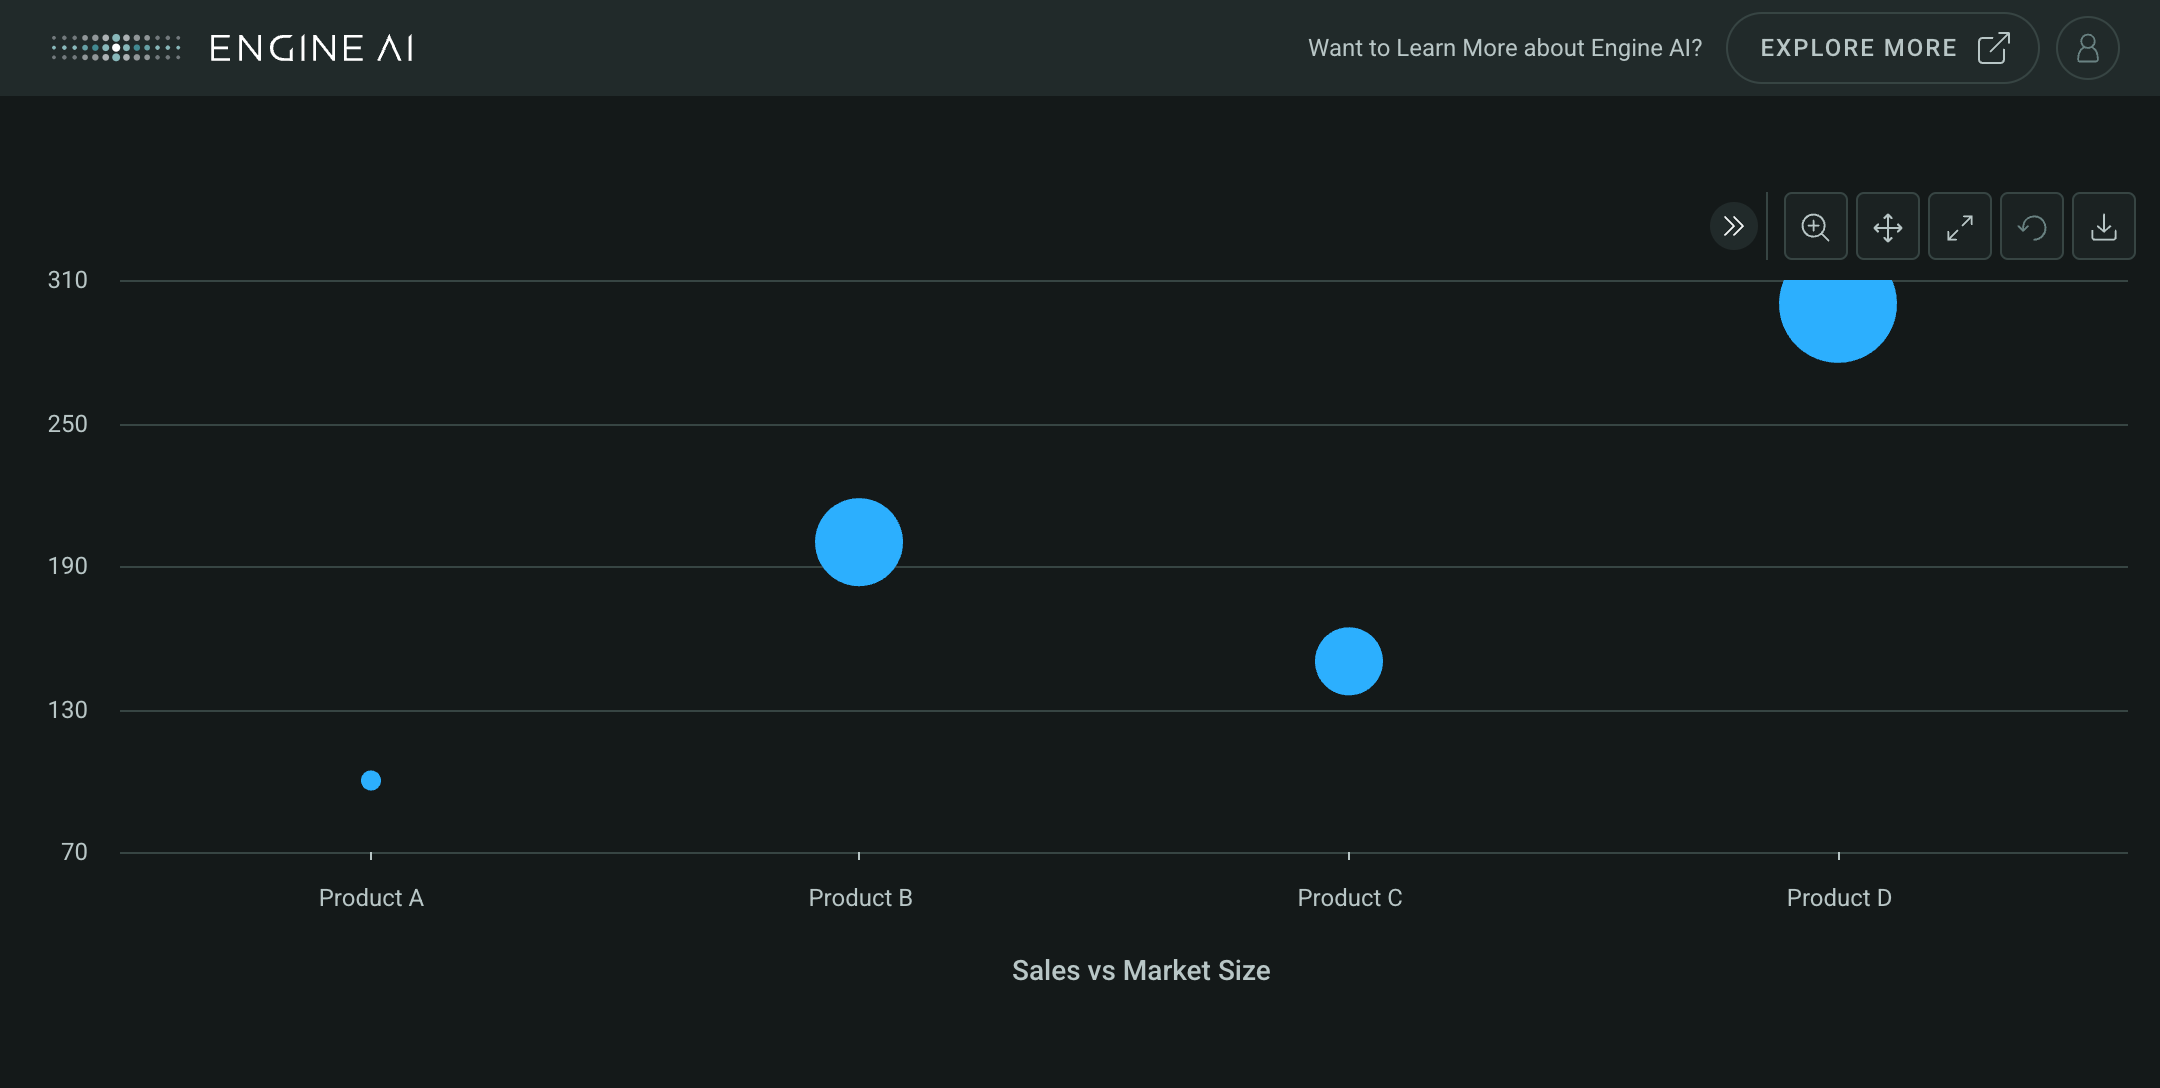
Create a Categorical widget with BubbleSeries
import pandas as pd

from engineai.sdk.dashboard.dashboard import Dashboard
from engineai.sdk.dashboard.widgets import categorical

data_bubble = pd.DataFrame(
    {
        "category": ["Product A", "Product B", "Product C", "Product D"],
        "sales": [100, 200, 150, 300],
        "profit": [20, 50, 30, 80],
        "market_size": [1000, 2000, 1500, 3000],
    }
)

bubble_series = categorical.BubbleSeries(
    data_column="sales",
    bubble_size_data_column="market_size",
    name="Sales vs Market Size",
    bubble_name="Market Size",
)

categorical_widget_bubble = categorical.Categorical(
    data=data_bubble,
    category_axis="category",
    value_axis=bubble_series,
)

Dashboard(
    workspace_slug="my-workspace",
    app_slug="my-app",
    slug="first-dashboard",
    content=categorical_widget_bubble,
)
ErrorBarSeries #
ErrorBarSeries(
    *,
    low_data_column: str | GenericLink,
    high_data_column: str | GenericLink,
    name: str | GenericLink | None = None,
    styling: Palette | ErrorBarSeriesStyling | None = None,
    stack: str | GenericLink | None = None,
    show_in_legend: bool = True,
    required: bool = True,
    visible: bool = True,
    tooltips: list[TooltipItem] | None = None,
)
Spec forError Bar Series of a Categorical widget.
Construct Column Series.
Parameters:
| Name | Type | Description | Default |
|---|---|---|---|
low_data_column
|
str | GenericLink
|
name of column in pandas dataframe(s) used for the low value of this series. |
required |
high_data_column
|
str | GenericLink
|
name of column in pandas dataframe(s) used for the high value of this series. |
required |
name
|
str | GenericLink | None
|
series name (shown in legend and tooltip). |
None
|
styling
|
Palette | ErrorBarSeriesStyling | None
|
styling spec. |
None
|
stack
|
str | GenericLink | None
|
id of stack for column. |
None
|
show_in_legend
|
bool
|
whether to show series in legend or not. |
True
|
required
|
bool
|
Flag to make the Series mandatory. If required == True and no Data the widget will show an error. If required==False and no Data, the widget hides the Series. |
True
|
visible
|
bool
|
Flag to make the Series visible when chart is loaded. |
True
|
tooltips
|
list[TooltipItem] | None
|
Tooltip items to show in the tooltip. |
None
|
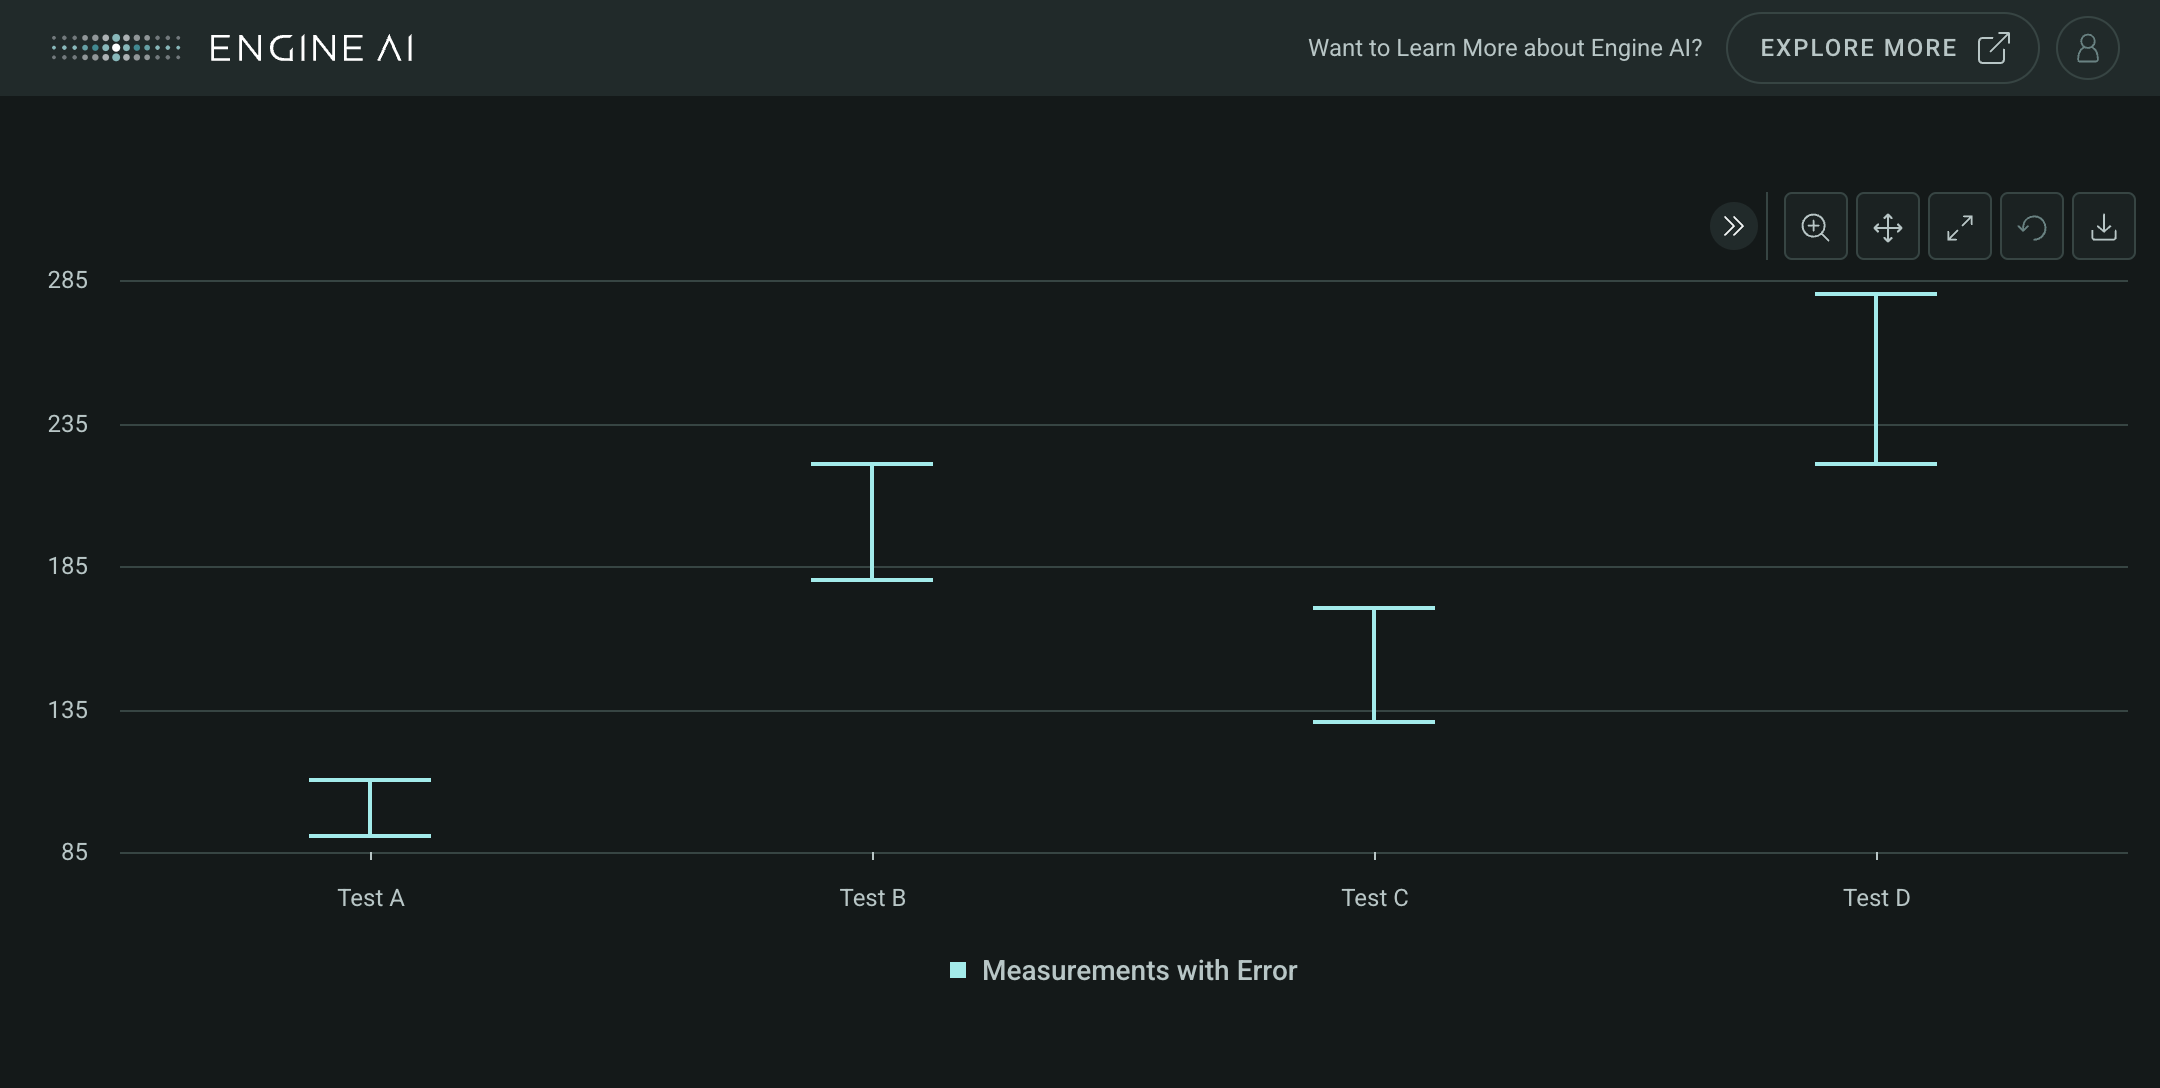
Create a Categorical widget with ErrorBarSeries
import pandas as pd

from engineai.sdk.dashboard.dashboard import Dashboard
from engineai.sdk.dashboard.styling.color.palette import Palette
from engineai.sdk.dashboard.widgets import categorical

data_error = pd.DataFrame(
    {
        "category": ["Test A", "Test B", "Test C", "Test D"],
        "value": [100, 200, 150, 250],
        "error_low": [90, 180, 130, 220],
        "error_high": [110, 220, 170, 280],
    }
)

error_bar_series = categorical.ErrorBarSeries(
    low_data_column="error_low",
    high_data_column="error_high",
    name="Measurements with Error",
    styling=Palette.AQUA_GREEN,
)

categorical_widget_error = categorical.Categorical(
    data=data_error,
    category_axis="category",
    value_axis=error_bar_series,
)

Dashboard(
    workspace_slug="my-workspace",
    app_slug="my-app",
    slug="first-dashboard",
    content=categorical_widget_error,
)
ColumnSeries #
ColumnSeries(
    *,
    data_column: str | GenericLink,
    name: str | GenericLink | None = None,
    styling: Palette | ColumnSeriesStyling | None = None,
    stack: str | GenericLink | None = None,
    show_in_legend: bool = True,
    required: bool = True,
    visible: bool = True,
    tooltips: list[TooltipItem] | None = None,
)
Spec for a Column Series of a Categorical widget.
Construct Column Series.
Parameters:
| Name | Type | Description | Default |
|---|---|---|---|
data_column
|
str | GenericLink
|
name of column in pandas dataframe(s) used for the values of this series for the Y Axis. |
required |
name
|
str | GenericLink | None
|
series name (shown in legend and tooltip). |
None
|
styling
|
Palette | ColumnSeriesStyling | None
|
styling spec. |
None
|
stack
|
str | GenericLink | None
|
id of stack for column. |
None
|
show_in_legend
|
bool
|
whether to show series in legend or not. |
True
|
required
|
bool
|
Flag to make the Series mandatory. If required == True and no Data the widget will show an error. If required==False and no Data, the widget hides the Series. |
True
|
visible
|
bool
|
Flag to make the Series visible when chart is loaded. |
True
|
tooltips
|
list[TooltipItem] | None
|
Tooltip items to show in the tooltip. |
None
|
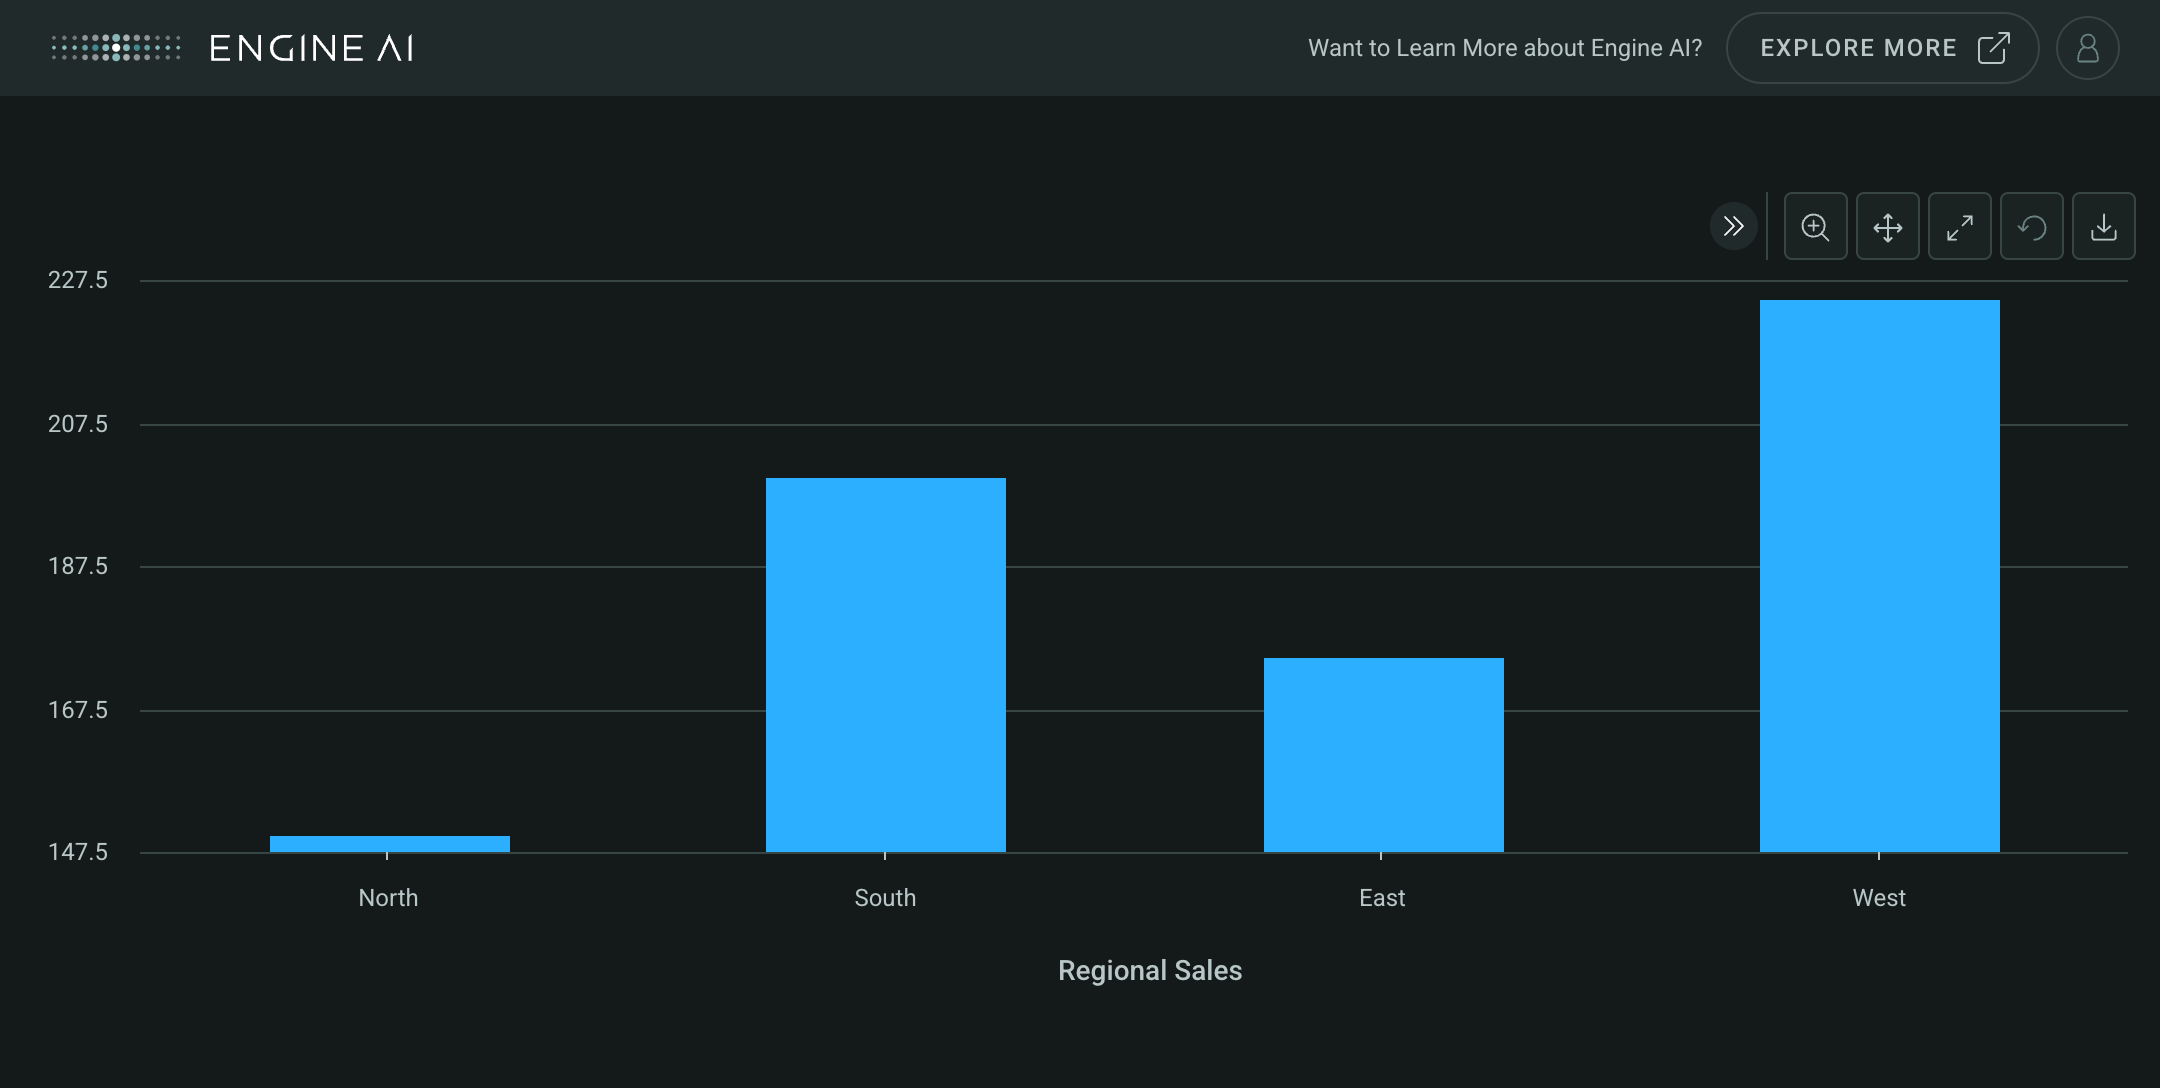
Create a Categorical widget with ColumnSeries
import pandas as pd

from engineai.sdk.dashboard.dashboard import Dashboard
from engineai.sdk.dashboard.widgets import categorical

data_column = pd.DataFrame(
    {
        "category": ["North", "South", "East", "West"],
        "sales": [150, 200, 175, 225],
    }
)

column_series = categorical.ColumnSeries(
    data_column="sales",
    name="Regional Sales",
)

categorical_widget_column = categorical.Categorical(
    data=data_column,
    category_axis="category",
    value_axis=column_series,
)

Dashboard(
    workspace_slug="my-workspace",
    app_slug="my-app",
    slug="first-dashboard",
    content=categorical_widget_column,
)
LineSeries #
LineSeries(
    *,
    data_column: str | GenericLink,
    name: str | GenericLink | None = None,
    styling: Palette | LineSeriesStyling | None = None,
    show_in_legend: bool = True,
    required: bool = True,
    visible: bool = True,
    tooltips: list[TooltipItem] | None = None,
)
Spec for a Line Series of a Categorical widget.
Construct Line Series.
Parameters:
| Name | Type | Description | Default |
|---|---|---|---|
data_column
|
str | GenericLink
|
name of column in pandas dataframe(s) used for the values of this series for the Y Axis. |
required |
name
|
str | GenericLink | None
|
series name (shown in legend and tooltip). |
None
|
styling
|
Palette | LineSeriesStyling | None
|
styling spec. |
None
|
show_in_legend
|
bool
|
whether to show series in legend or not. |
True
|
required
|
bool
|
Flag to make the Series mandatory. If required == True and no Data the widget will show an error. If required==False and no Data, the widget hides the Series. |
True
|
visible
|
bool
|
Flag to make the Series visible when chart is loaded. |
True
|
tooltips
|
list[TooltipItem] | None
|
Tooltip items to show in the tooltip. |
None
|
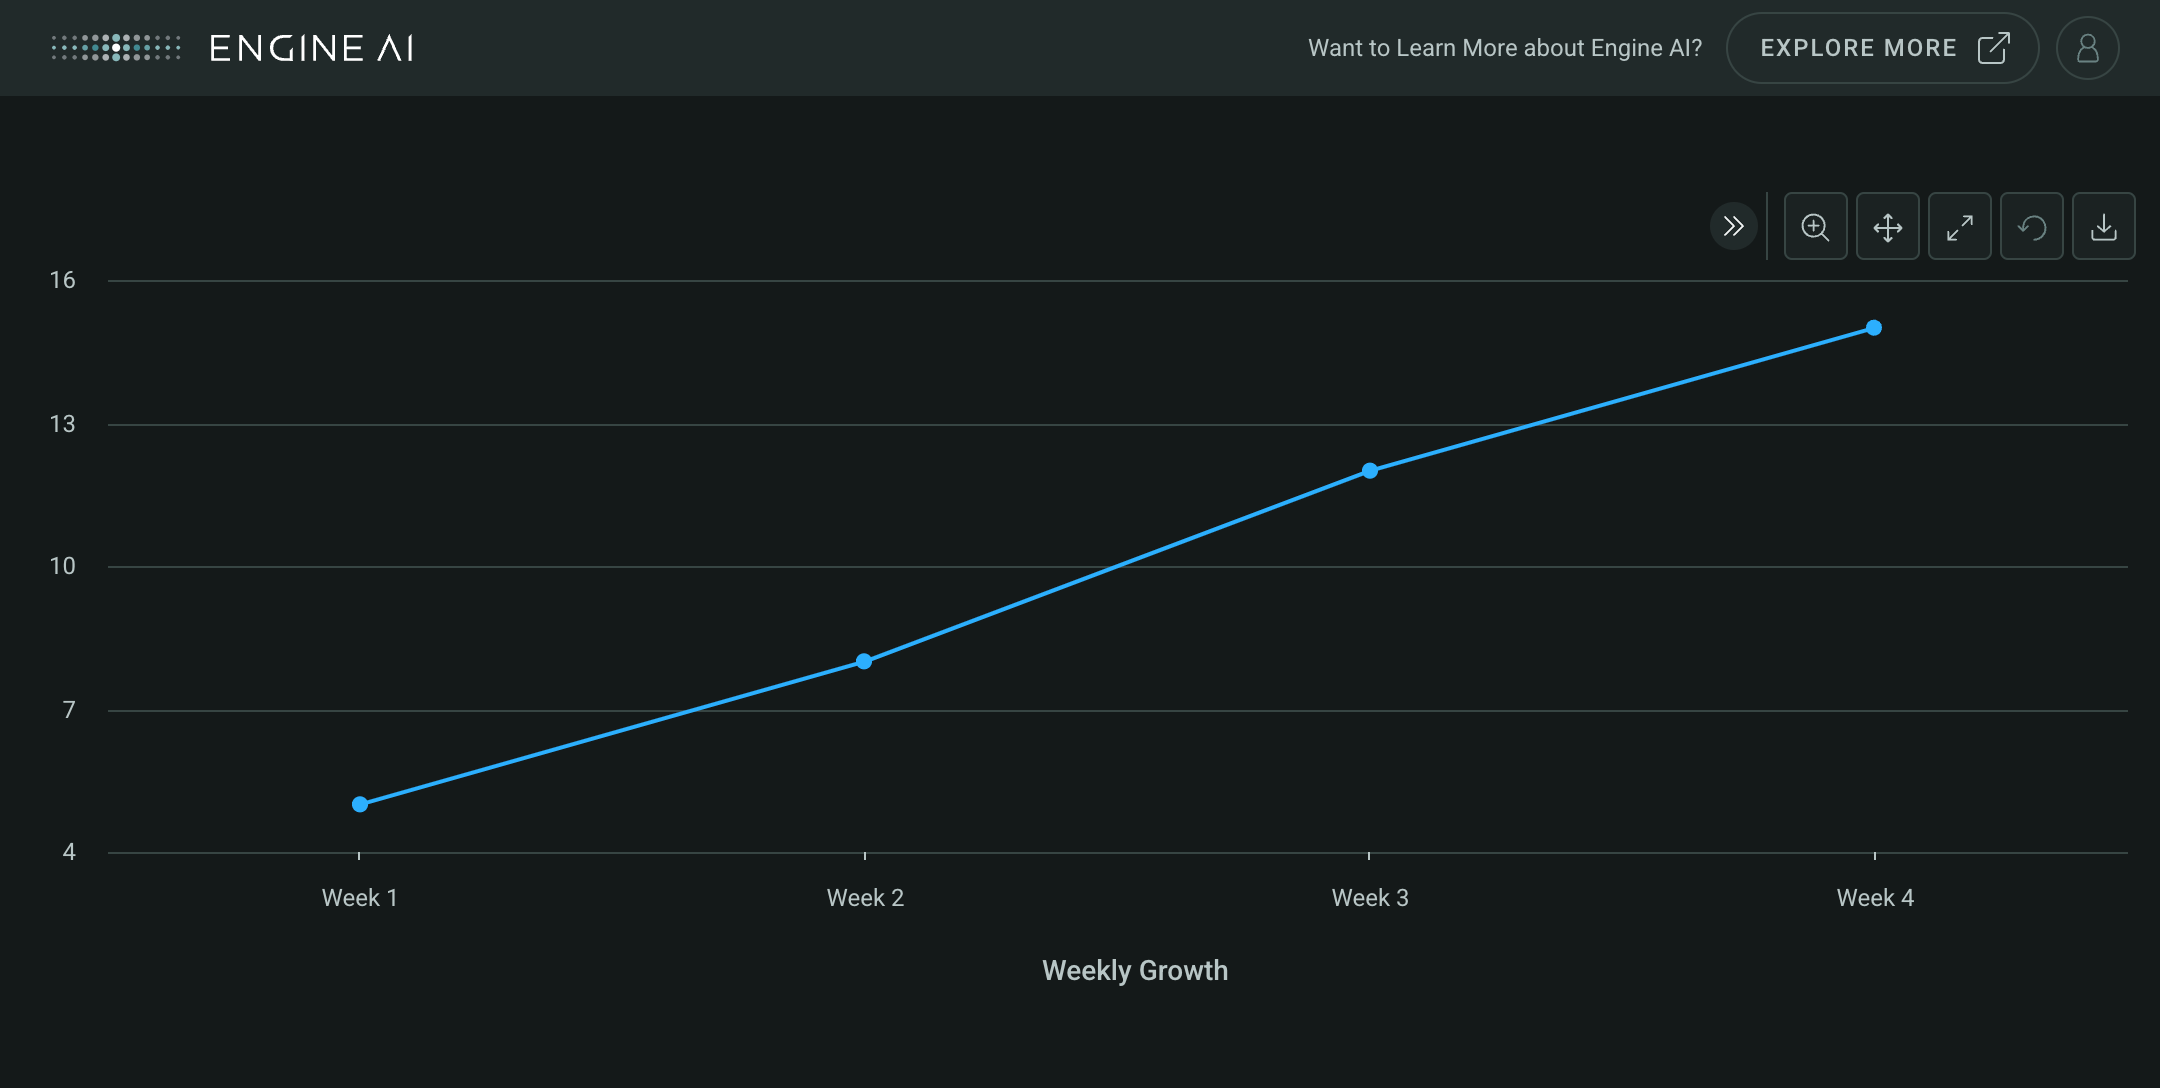
Create a Categorical widget with LineSeries
import pandas as pd

from engineai.sdk.dashboard.dashboard import Dashboard
from engineai.sdk.dashboard.widgets import categorical

data_line = pd.DataFrame(
    {
        "category": ["Week 1", "Week 2", "Week 3", "Week 4"],
        "growth": [5, 8, 12, 15],
    }
)

line_series = categorical.LineSeries(
    data_column="growth",
    name="Weekly Growth",
)

categorical_widget_line = categorical.Categorical(
    data=data_line,
    category_axis="category",
    value_axis=line_series,
)

Dashboard(
    workspace_slug="my-workspace",
    app_slug="my-app",
    slug="first-dashboard",
    content=categorical_widget_line,
)
PointSeries #
PointSeries(
    *,
    data_column: str | GenericLink,
    name: str | GenericLink | None = None,
    styling: Palette | PointSeriesStyling | None = None,
    show_in_legend: bool = True,
    required: bool = True,
    visible: bool = True,
    tooltips: list[TooltipItem] | None = None,
)
Spec for a Point Series of a Categorical widget.
Construct Point Series.
Parameters:
| Name | Type | Description | Default |
|---|---|---|---|
data_column
|
str | GenericLink
|
name of column in pandas dataframe(s) used for the values of this series for the Y Axis. |
required |
name
|
str | GenericLink | None
|
series name (shown in legend and tooltip). |
None
|
styling
|
Palette | PointSeriesStyling | None
|
styling spec. |
None
|
show_in_legend
|
bool
|
whether to show series in legend or not. |
True
|
required
|
bool
|
Flag to make the Series mandatory. If required == True and no Data the widget will show an error. If required==False and no Data, the widget hides the Series. |
True
|
visible
|
bool
|
Flag to make the Series visible when chart is loaded. |
True
|
tooltips
|
list[TooltipItem] | None
|
Tooltip items to show in the tooltip. |
None
|
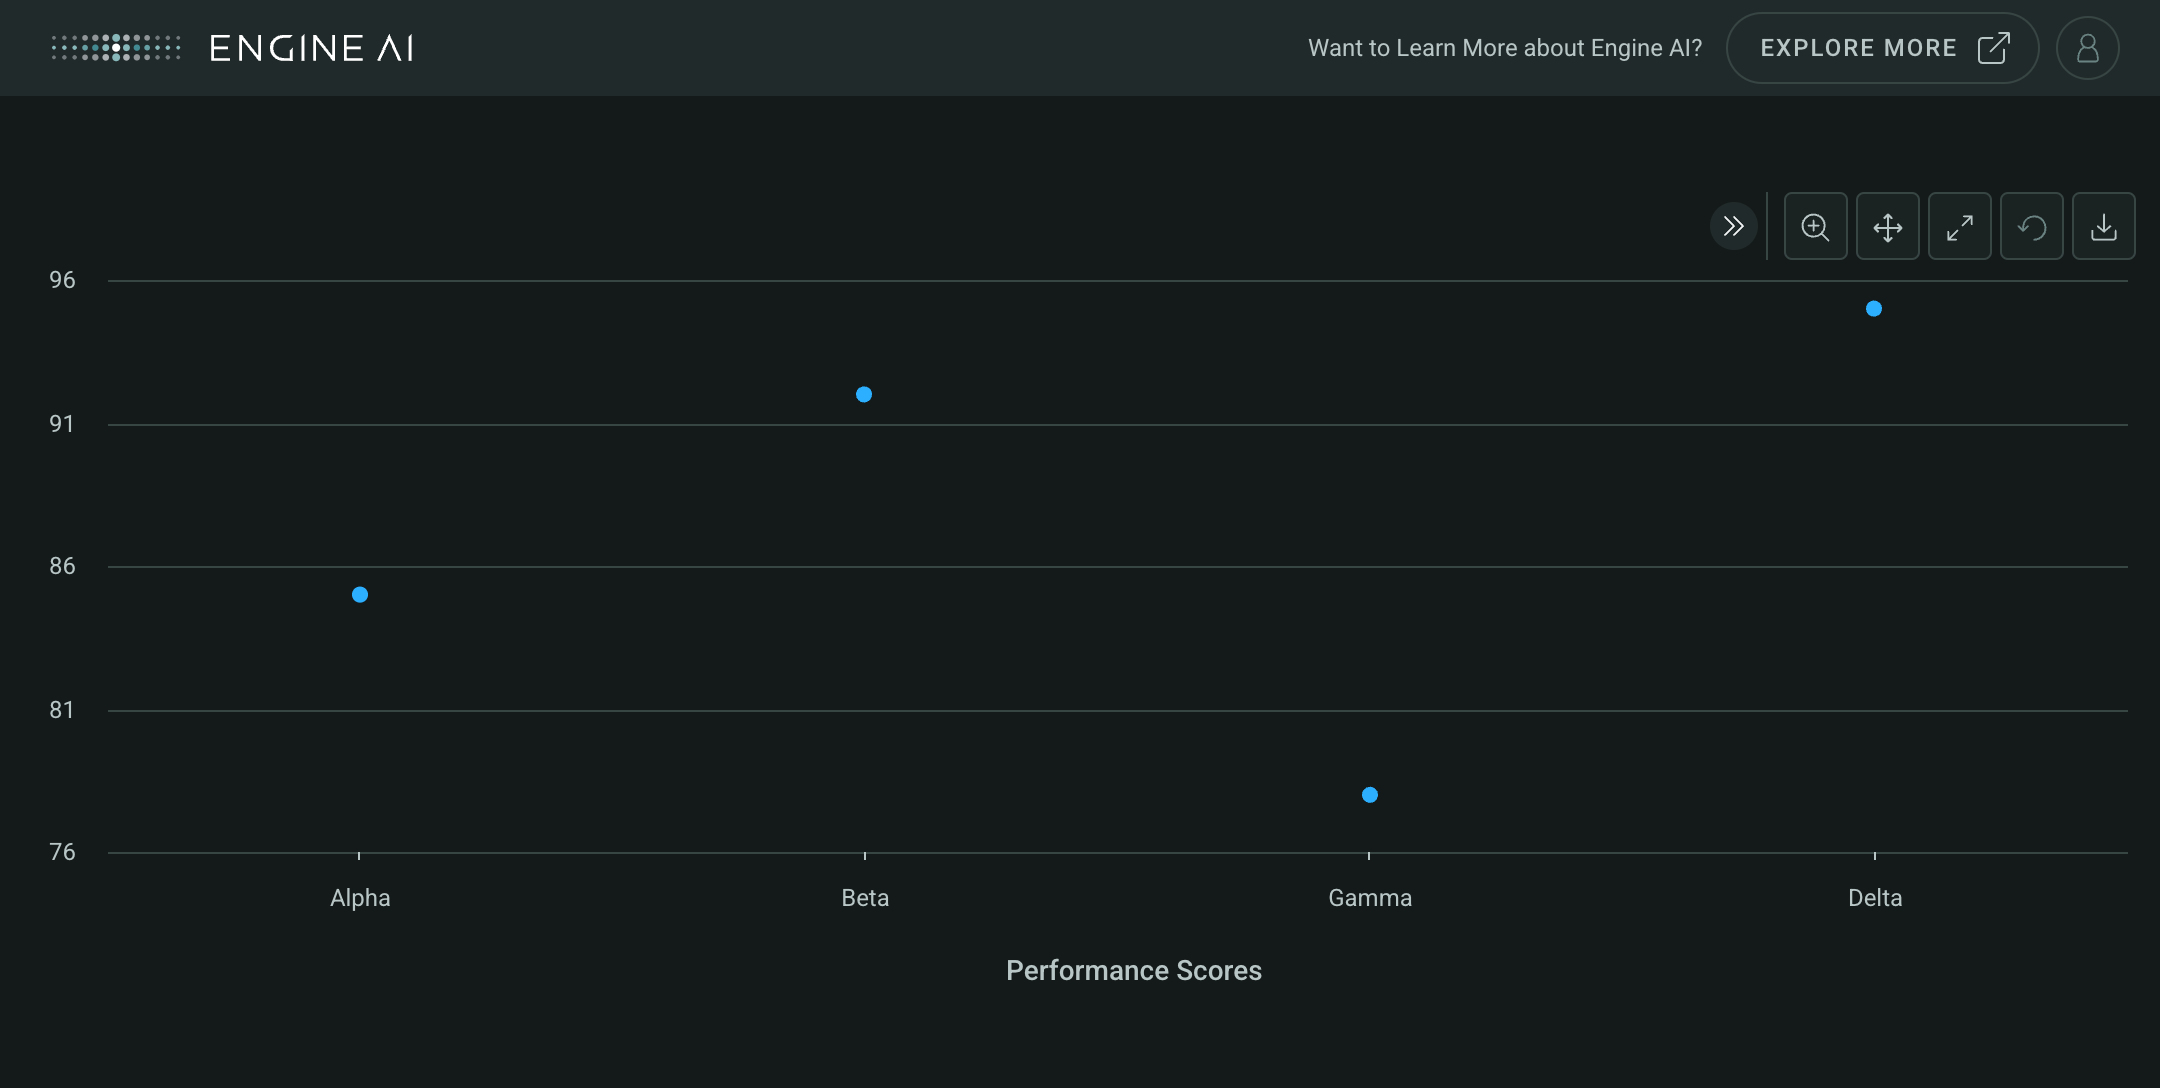
Create a Categorical widget with PointSeries
import pandas as pd

from engineai.sdk.dashboard.dashboard import Dashboard
from engineai.sdk.dashboard.widgets import categorical

data_point = pd.DataFrame(
    {
        "category": ["Alpha", "Beta", "Gamma", "Delta"],
        "score": [85, 92, 78, 95],
    }
)

point_series = categorical.PointSeries(
    data_column="score",
    name="Performance Scores",
)

categorical_widget_point = categorical.Categorical(
    data=data_point,
    category_axis="category",
    value_axis=point_series,
)

Dashboard(
    workspace_slug="my-workspace",
    app_slug="my-app",
    slug="first-dashboard",
    content=categorical_widget_point,
)
ScatterSeries #
ScatterSeries(
    *,
    data_column: str | GenericLink,
    name: str | GenericLink | None = None,
    styling: Palette | ScatterSeriesStyling | None = None,
    show_in_legend: bool = True,
    required: bool = True,
    visible: bool = True,
    tooltips: list[TooltipItem] | None = None,
)
Spec for a Scatter Series of a Categorical widget.
Construct Scatter Series.
Parameters:
| Name | Type | Description | Default |
|---|---|---|---|
data_column
|
str | GenericLink
|
name of column in pandas dataframe(s) used for the values of this series for the Y Axis. |
required |
name
|
str | GenericLink | None
|
series name (shown in legend and tooltip). |
None
|
styling
|
Palette | ScatterSeriesStyling | None
|
styling spec. |
None
|
show_in_legend
|
bool
|
whether to show series in legend or not. |
True
|
required
|
bool
|
Flag to make the Series mandatory. If required == True and no Data the widget will show an error. If required==False and no Data, the widget hides the Series. |
True
|
visible
|
bool
|
Flag to make the Series visible when chart is loaded. |
True
|
tooltips
|
list[TooltipItem] | None
|
Tooltip items to show in the tooltip. |
None
|
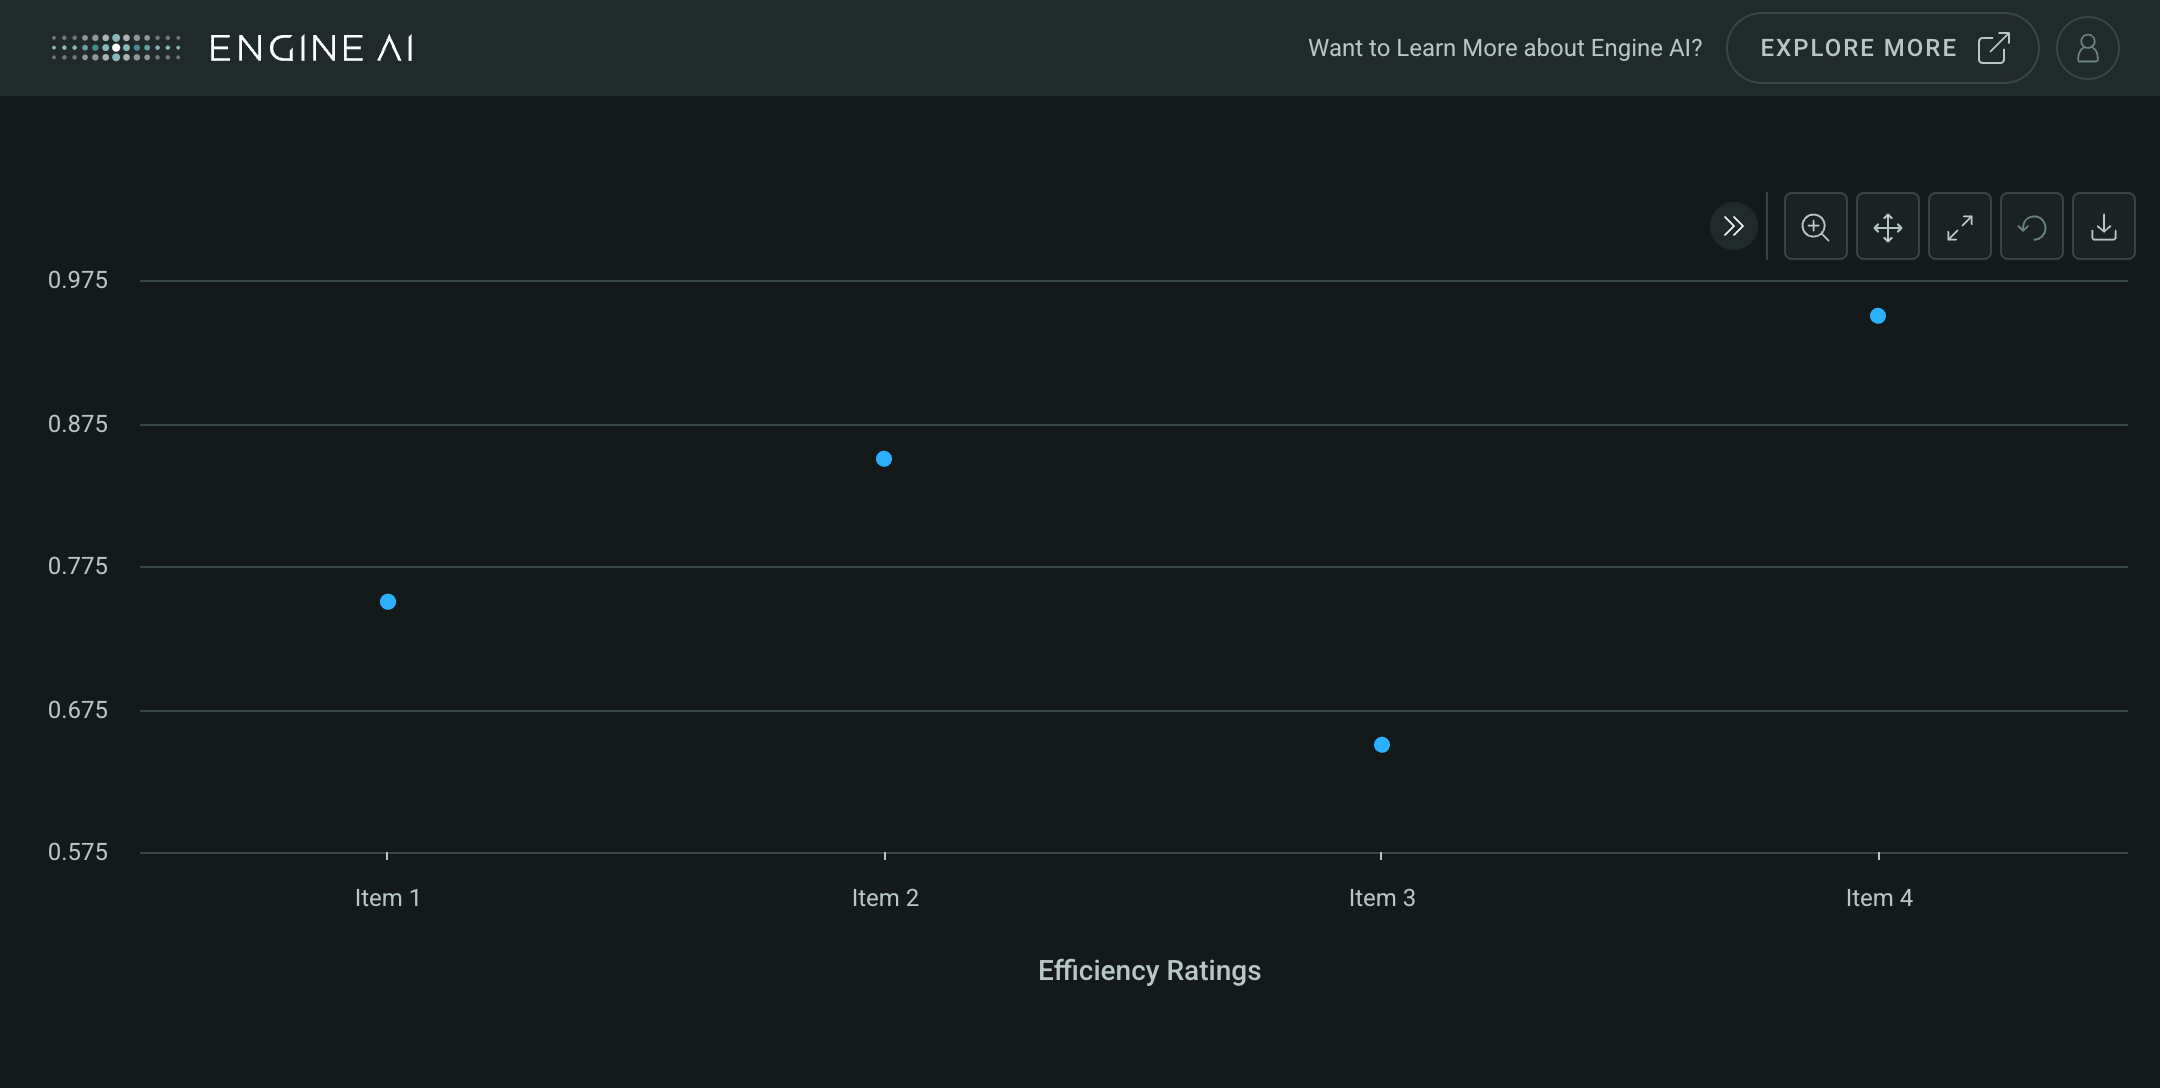
Create a Categorical widget with ScatterSeries
import pandas as pd

from engineai.sdk.dashboard.dashboard import Dashboard
from engineai.sdk.dashboard.widgets import categorical

data_scatter = pd.DataFrame(
    {
        "category": ["Item 1", "Item 2", "Item 3", "Item 4"],
        "efficiency": [0.75, 0.85, 0.65, 0.95],
    }
)

scatter_series = categorical.ScatterSeries(
    data_column="efficiency",
    name="Efficiency Ratings",
)

categorical_widget_scatter = categorical.Categorical(
    data=data_scatter,
    category_axis="category",
    value_axis=scatter_series,
)

Dashboard(
    workspace_slug="my-workspace",
    app_slug="my-app",
    slug="first-dashboard",
    content=categorical_widget_scatter,
)
Axis lines and bands#
AxisLine #
AxisLine(
    data: DataType | DataFrame,
    *,
    data_column: str,
    label: str | AxisLabel | None = None,
    styling: Palette | AxisLineStyling | None = None,
    dash_style: DashStyle = DASH,
)
Spec for Axis Line.
Construct a plot line for an axis.
Parameters:
| Name | Type | Description | Default |
|---|---|---|---|
data
|
DataType | DataFrame
|
data source for the Axis line. |
required |
data_column
|
str
|
name of column in pandas dataframe(s) used for the value of axis line |
required |
label
|
str | AxisLabel | None
|
label annotation. |
None
|
styling
|
Palette | AxisLineStyling | None
|
specs for chart band styling. |
None
|
dash_style
|
DashStyle
|
line dash style. |
DASH
|
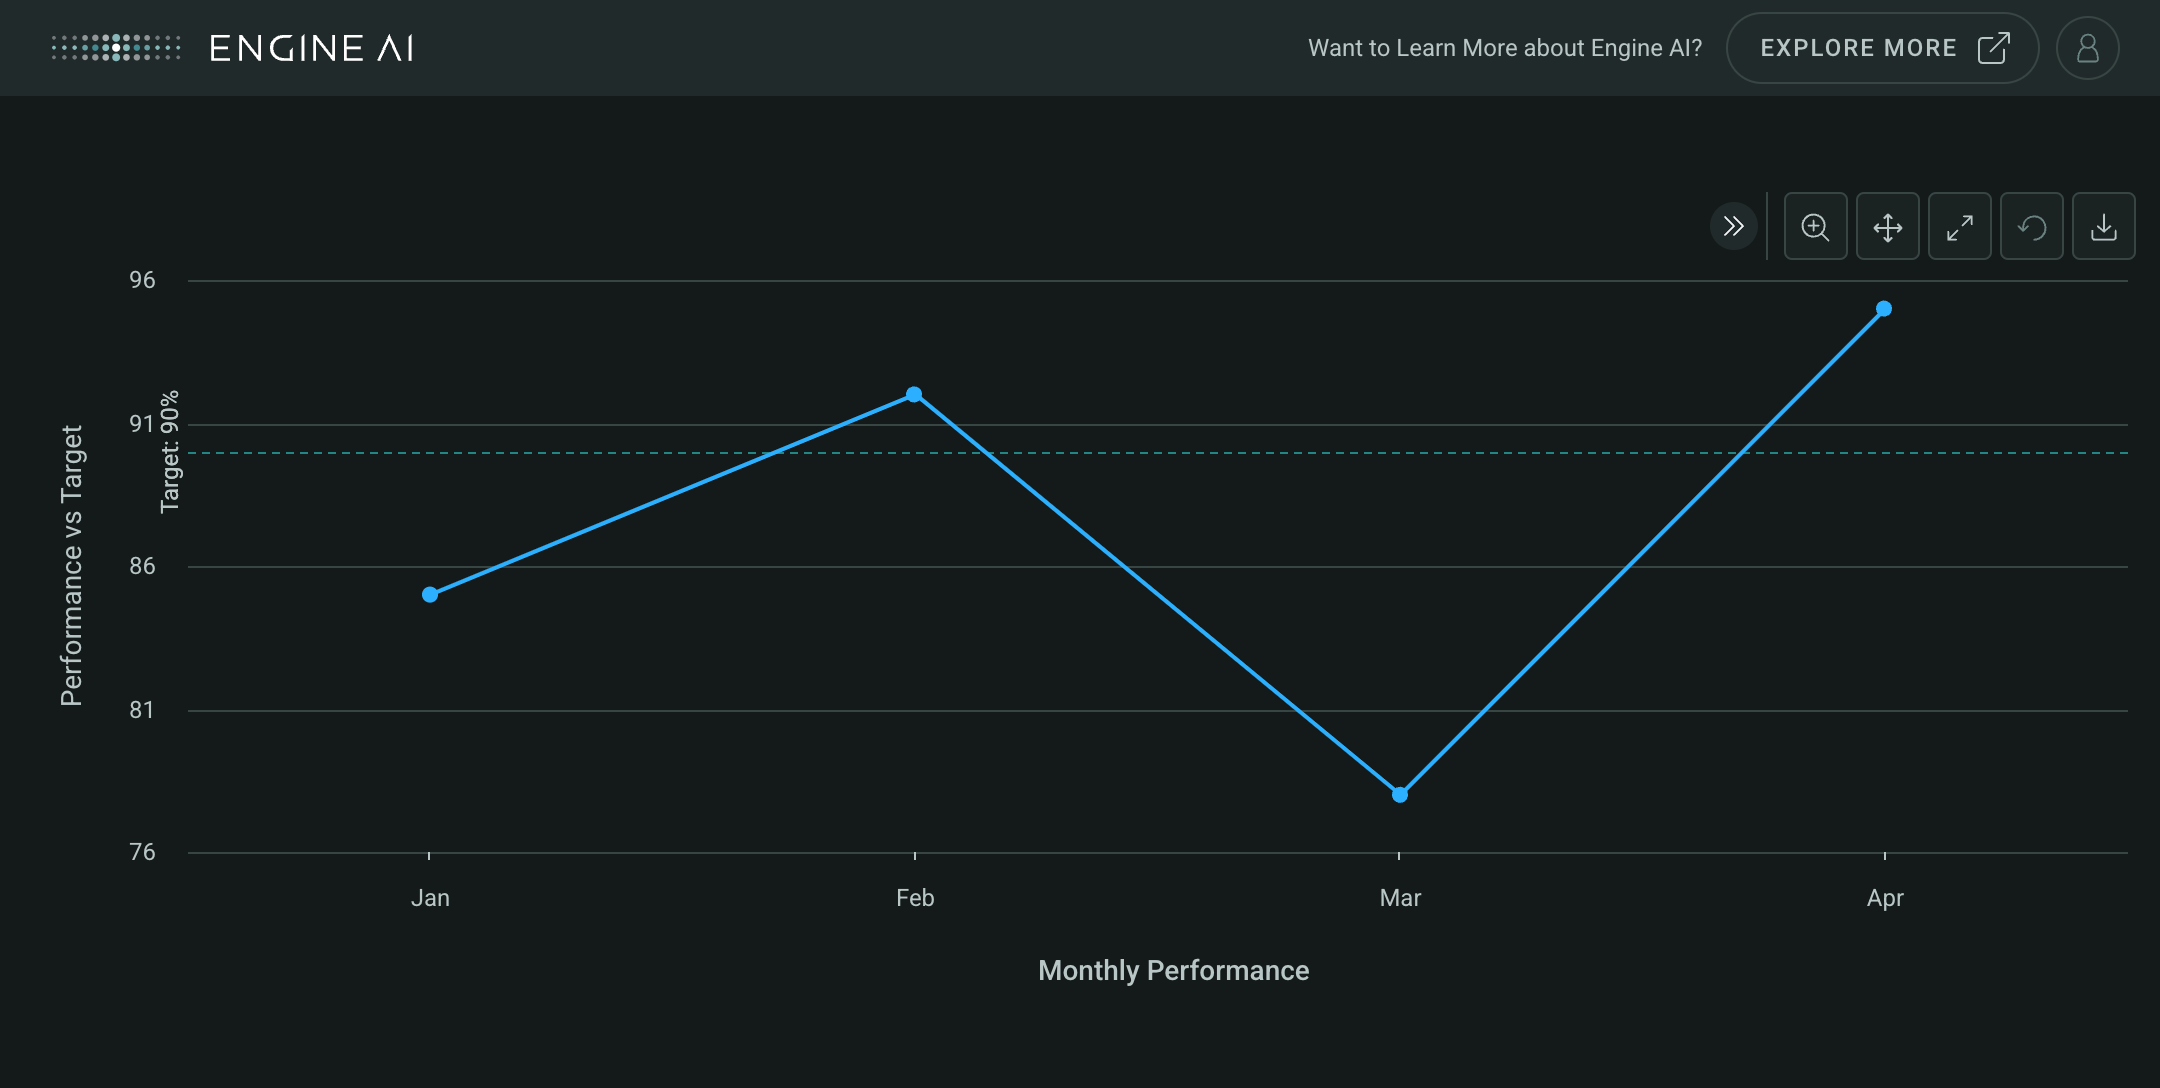
Create a Categorical widget with AxisLine
import pandas as pd

from engineai.sdk.dashboard.dashboard import Dashboard
from engineai.sdk.dashboard.enum.align import HorizontalAlignment
from engineai.sdk.dashboard.widgets import categorical

data_line = pd.DataFrame(
    {
        "category": ["Jan", "Feb", "Mar", "Apr"],
        "performance": [85, 92, 78, 95],
    }
)

axis_line_data = pd.DataFrame(
    {
        "target_value": [90],
    }
)

axis_line = categorical.AxisLine(
    data=axis_line_data,
    data_column="target_value",
    label=categorical.AxisLabel(
        text="Target: 90%",
        x_position=-5,
        y_position=30,
        horizontal_align=HorizontalAlignment.LEFT,
    ),
)

performance_series = categorical.LineSeries(
    data_column="performance",
    name="Monthly Performance",
)

categorical_widget_line = categorical.Categorical(
    data=data_line,
    category_axis="category",
    value_axis=categorical.ValueAxis(
        series=performance_series,
        line=axis_line,
        title="Performance vs Target",
    ),
)

Dashboard(
    workspace_slug="my-workspace",
    app_slug="my-app",
    slug="first-dashboard",
    content=categorical_widget_line,
)
AxisBand #
AxisBand(
    data: DataType | DataFrame,
    *,
    from_column: str,
    to_column: str,
    label: str | AxisLabel | None = None,
    styling: Palette | AxisBandStyling | None = None,
)
Spec for Axis Band.
Construct a plot line for an axis.
Parameters:
| Name | Type | Description | Default |
|---|---|---|---|
data
|
DataType | DataFrame
|
data source for the Axis Band. |
required |
from_column
|
str
|
name of column in pandas dataframe(s) used for the start value for the band. |
required |
to_column
|
str
|
name of column in pandas dataframe(s) used for the end value for the band. |
required |
label
|
str | AxisLabel | None
|
label annotation. |
None
|
styling
|
Palette | AxisBandStyling | None
|
specs for chart band styling. |
None
|
Create a Categorical widget with AxisBand
import pandas as pd

from engineai.sdk.dashboard.dashboard import Dashboard
from engineai.sdk.dashboard.enum.align import HorizontalAlignment, VerticalAlignment
from engineai.sdk.dashboard.widgets import categorical

data_band = pd.DataFrame(
    {
        "category": ["Week 1", "Week 2", "Week 3", "Week 4"],
        "sales": [100, 120, 140, 160],
    }
)

axis_band_data = pd.DataFrame(
    {
        "band_from": [95, 120],
        "band_to": [105, 145],
    }
)

axis_band = categorical.AxisBand(
    data=axis_band_data,
    from_column="band_from",
    to_column="band_to",
    label=categorical.AxisLabel(
        text="Optimal Range",
        horizontal_align=HorizontalAlignment.LEFT,
        vertical_align=VerticalAlignment.BOTTOM,
    ),
)

sales_series = categorical.ColumnSeries(
    data_column="sales",
    name="Weekly Sales",
)

categorical_widget_band = categorical.Categorical(
    data=data_band,
    category_axis="category",
    value_axis=categorical.ValueAxis(
        series=sales_series,
        band=axis_band,
        title="Sales with Target Band",
    ),
)

Dashboard(
    workspace_slug="my-workspace",
    app_slug="my-app",
    slug="first-dashboard",
    content=categorical_widget_band,
)
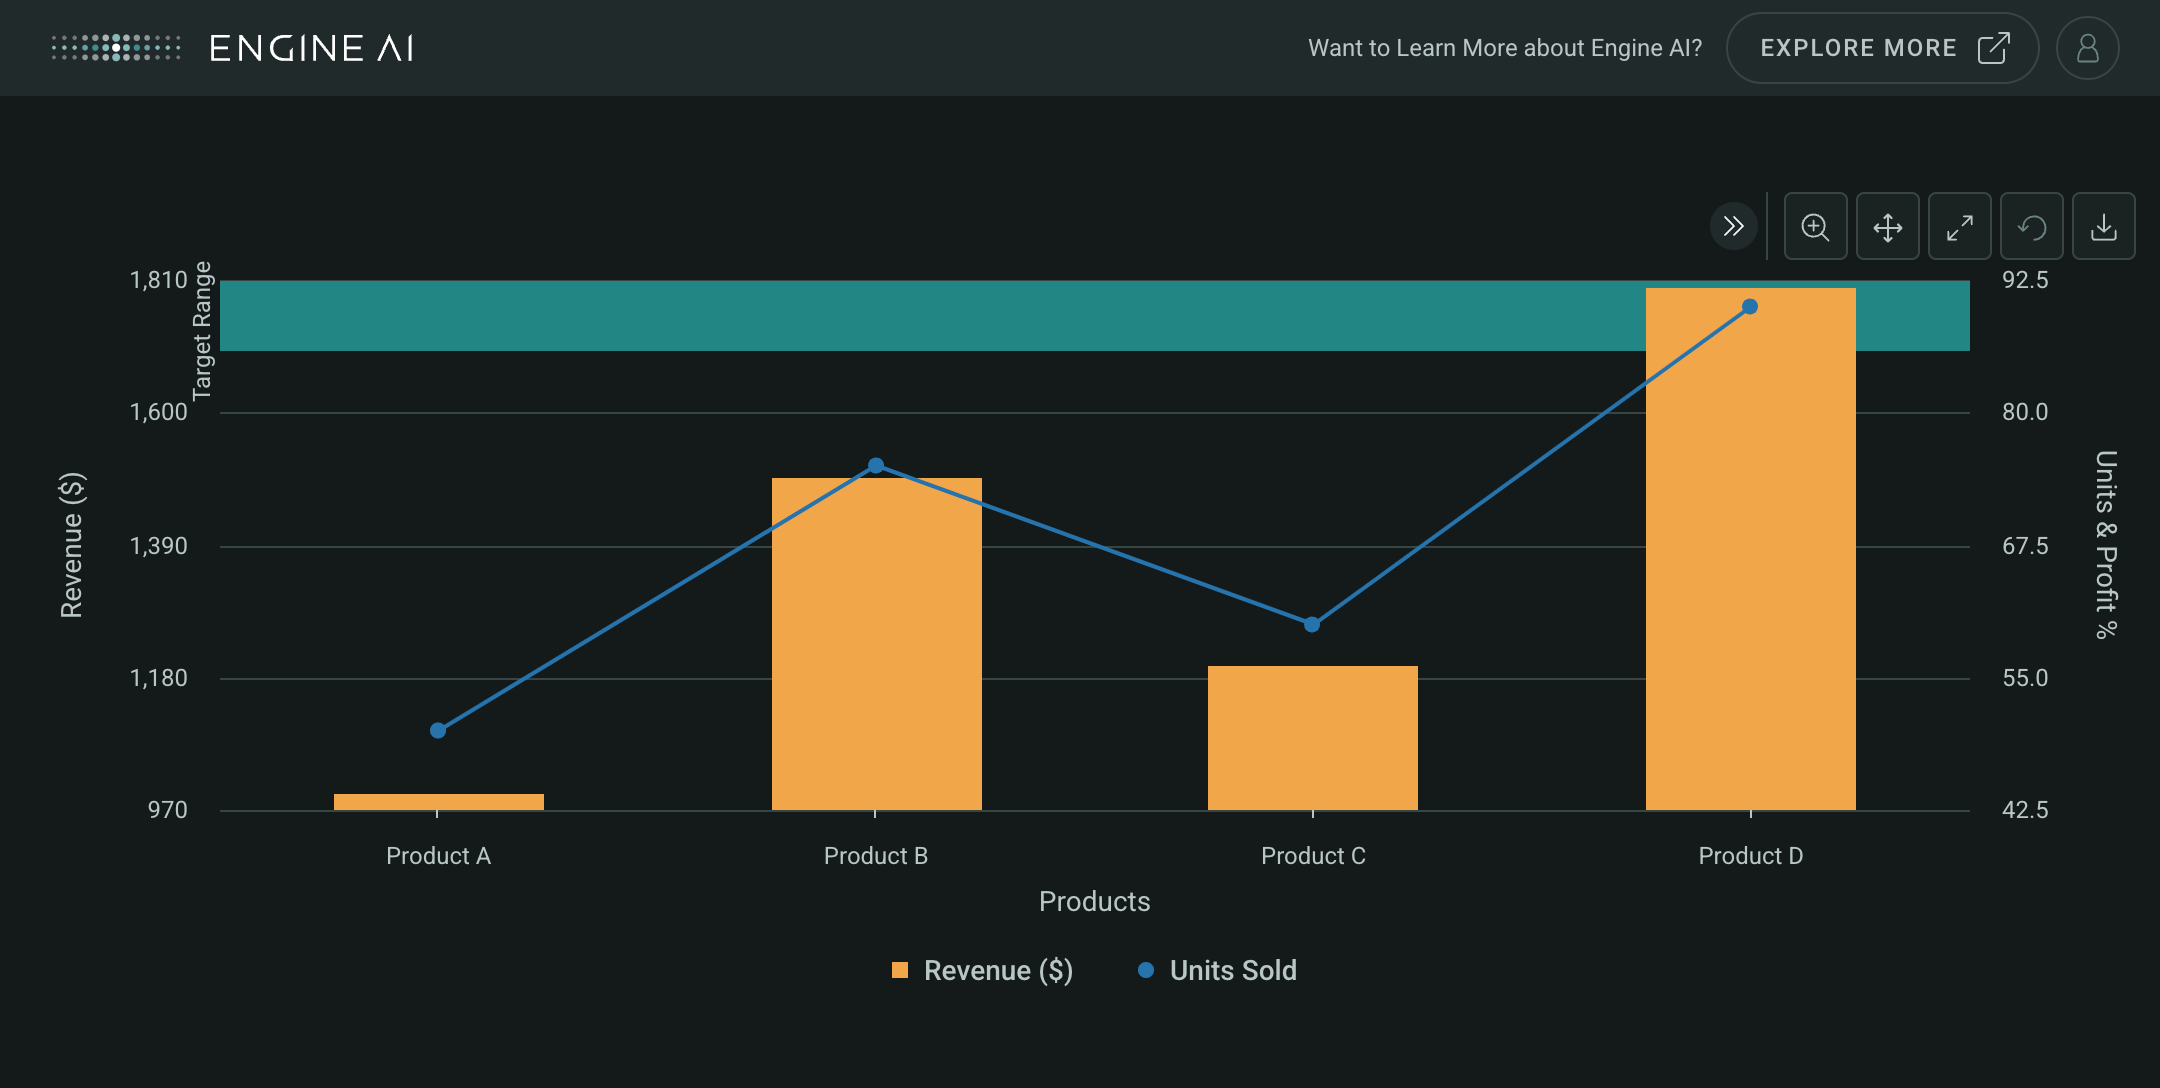
Create a Categorical widget with multiple Axis and AxisBand
import pandas as pd

from engineai.sdk.dashboard.dashboard import Dashboard
from engineai.sdk.dashboard.enum.align import HorizontalAlignment, VerticalAlignment
from engineai.sdk.dashboard.styling.color.palette import Palette
from engineai.sdk.dashboard.widgets import categorical
from engineai.sdk.dashboard.widgets.components.charts.styling import ColumnSeriesStyling, LineSeriesStyling

data_multiple = pd.DataFrame(
    {
        "category": ["Product A", "Product B", "Product C", "Product D"],
        "revenue": [1000, 1500, 1200, 1800],
        "units_sold": [50, 75, 60, 90],
        "profit_margin": [20, 25, 22, 28],
    }
)

revenue_series = categorical.ColumnSeries(
    data_column="revenue",
    name="Revenue ($)",
    styling=ColumnSeriesStyling(color_spec=Palette.GOLD_5),
)

units_series = categorical.LineSeries(
    data_column="units_sold",
    name="Units Sold",
    styling=LineSeriesStyling(color_spec=Palette.BLUE_POSITIVE_4),
)

revenue_target_data = pd.DataFrame(
    {
        "revenue_min": [1700],
        "revenue_max": [1900],
    }
)

revenue_target_band = categorical.AxisBand(
    data=revenue_target_data,
    from_column="revenue_min",
    to_column="revenue_max",
    label=categorical.AxisLabel(
        text="Target Range",
        x_position=-5,
        y_position=25,
        horizontal_align=HorizontalAlignment.LEFT,
        vertical_align=VerticalAlignment.BOTTOM,
    ),
)

primary_value_axis = categorical.ValueAxis(
    series=revenue_series,
    title="Revenue ($)",
    band=revenue_target_band,
)

secondary_value_axis = categorical.ValueAxis(
    series=units_series,
    title="Units & Profit %",
)

categorical_widget_multiple = categorical.Categorical(
    data=data_multiple,
    category_axis=categorical.CategoryAxis(
        data_column="category",
        title="Products",
    ),
    value_axis=primary_value_axis,
    secondary_value_axis=secondary_value_axis,
)

Dashboard(
    workspace_slug="my-workspace",
    app_slug="my-app",
    slug="first-dashboard",
    content=categorical_widget_multiple,
)
AxisLabel #
AxisLabel(
    *,
    text: str | DataField | None = None,
    x_position: int | DataField = -5,
    y_position: int | DataField = 2,
    horizontal_align: HorizontalAlignment = CENTER,
    vertical_align: VerticalAlignment = TOP,
    rotation: float | int | None = -90,
)
Spec for label of axis band or line.
Construct spec for label of axis band or line.
Parameters:
| Name | Type | Description | Default |
|---|---|---|---|
text
|
str | DataField | None
|
name of column in pandas dataframe(s) used for the label text. |
None
|
x_position
|
int | DataField
|
name of column in pandas dataframe(s) used for the x value for the label position. |
-5
|
y_position
|
int | DataField
|
name of column in pandas dataframe(s) used for they value for the label position. |
2
|
horizontal_align
|
HorizontalAlignment
|
horizontal alignment spec. |
CENTER
|
vertical_align
|
VerticalAlignment
|
vertical alignment spec. |
TOP
|
rotation
|
float | int | None
|
Rotation of the text label in degrees. |
-90
|
Types#
CategoricalSeries
module-attribute
#
CategoricalSeries = (
    LineSeries
    | AreaSeries
    | AreaRangeSeries
    | ColumnSeries
    | BubbleSeries
    | ScatterSeries
    | ErrorBarSeries
    | PointSeries
)
ValueAxisSeries
module-attribute
#
ValueAxisSeries = (
    str
    | list[str]
    | WidgetField
    | list[WidgetField]
    | CategoricalSeries
    | Sequence[CategoricalSeries]
)