Pie Chart#
Pie #
Pie(
    data: DataType | DataFrame,
    *,
    series: ChartSeries | None = None,
    legend_position: LegendPosition = BOTTOM,
    widget_id: str | None = None,
    title: WidgetTitleType | None = None,
    tooltips: TooltipItems | None = None,
)
Construct pie chart widget.
Construct a pie chart widget for visualizing data distribution, allowing customization of legends, tooltips, and series.
Constructor for Pie widget.
Parameters:
| Name | Type | Description | Default |
|---|---|---|---|
data
|
DataType | DataFrame
|
data for the widget. Can be a pandas dataframe or DataStorage object if the data is to be retrieved from a storage. |
required |
widget_id
|
str | None
|
unique widget id in a dashboard. |
None
|
title
|
WidgetTitleType | None
|
title of widget can be either a string (fixed value) or determined by a value from another widget using a WidgetLink. |
None
|
series
|
ChartSeries | None
|
Pie Series spec class. |
None
|
legend_position
|
LegendPosition
|
position of the legend within the pie. |
BOTTOM
|
tooltips
|
TooltipItems | None
|
tooltip items to be displayed at Chart level. |
None
|
Examples:#
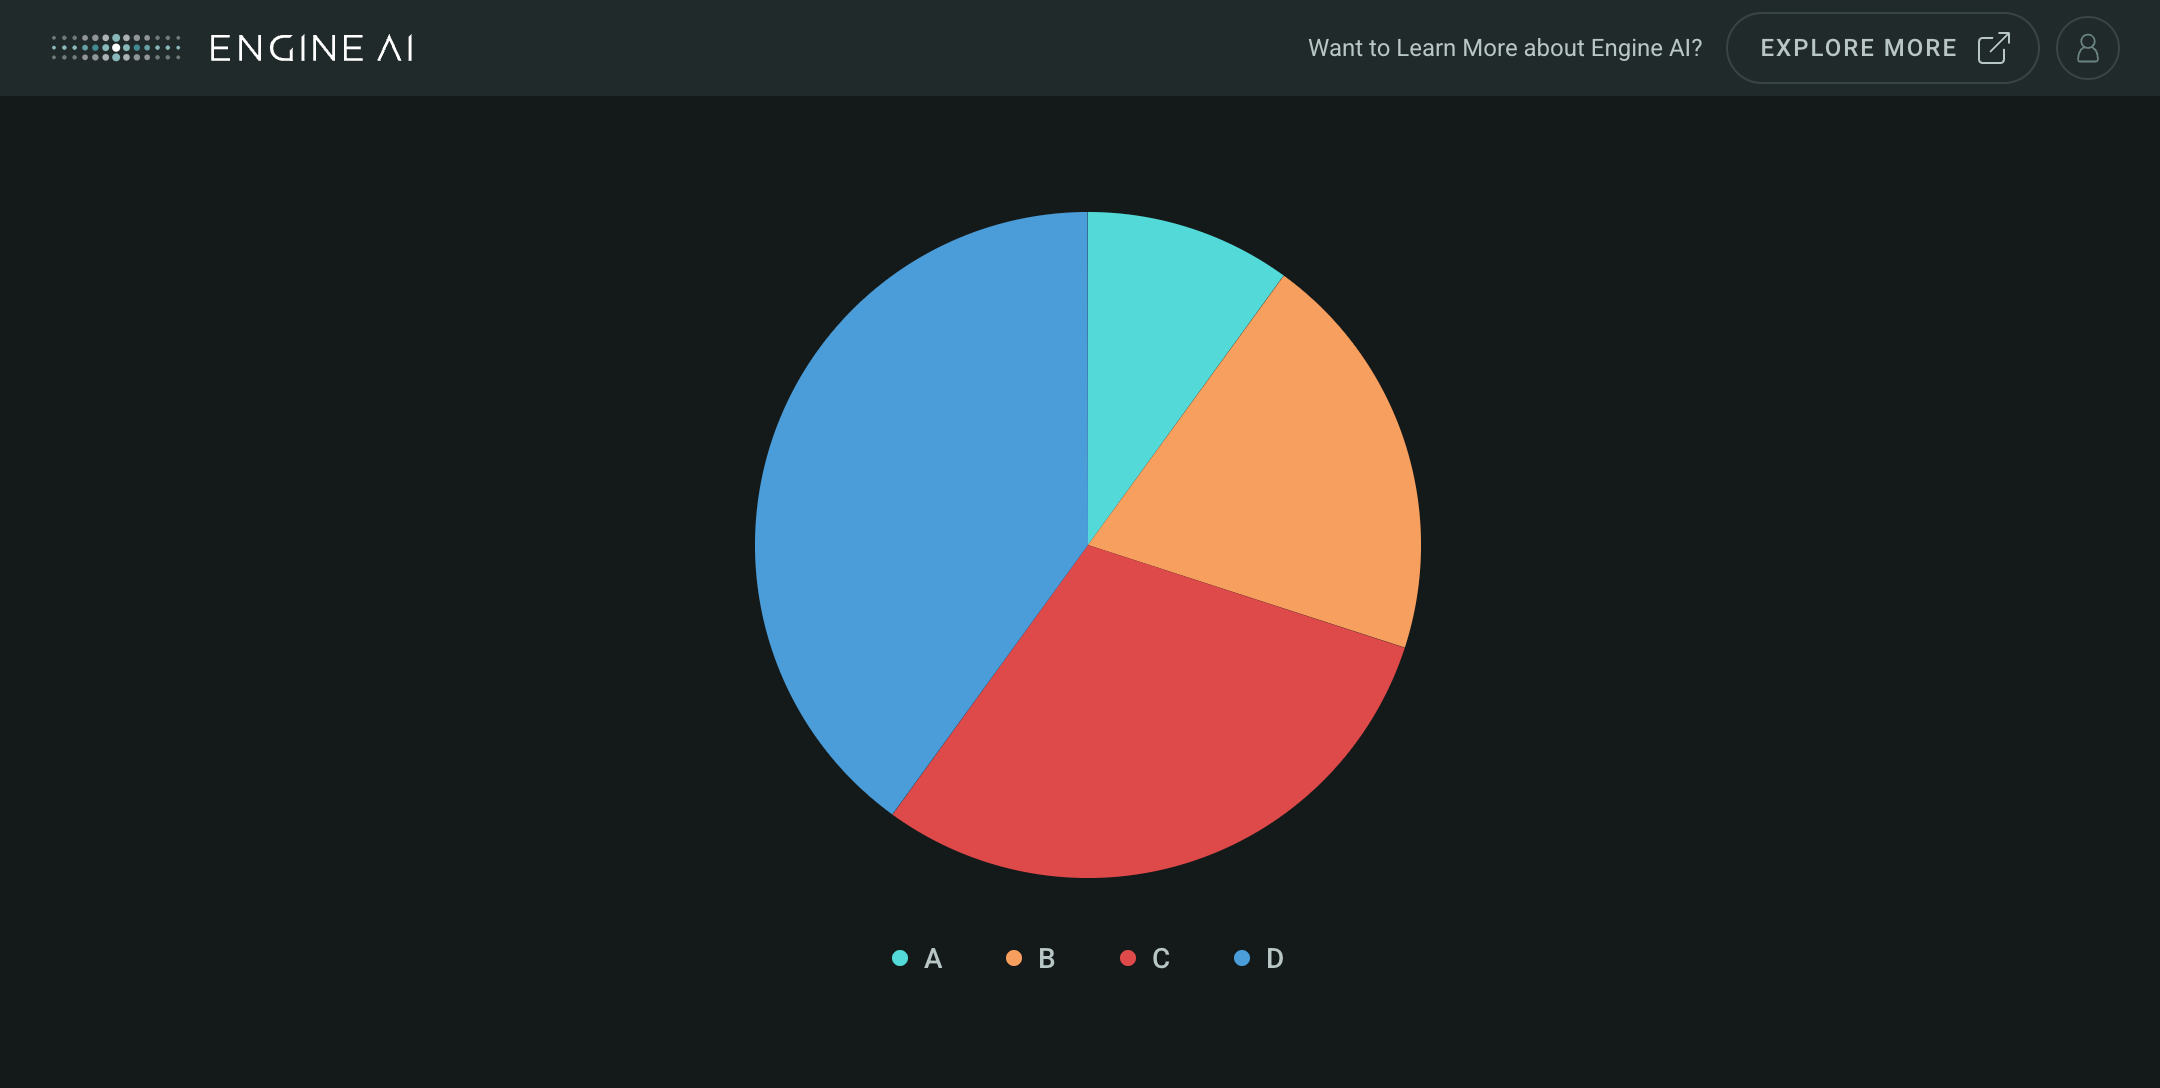
Create a minimal Pie Widget
import pandas as pd

from engineai.sdk.dashboard.dashboard import Dashboard
from engineai.sdk.dashboard.widgets import pie

data = pd.DataFrame(
    {
        "category": ["A", "B", "C", "D"],
        "value": [1, 2, 3, 4],
    },
)

pie_widget = pie.Pie(data=data)

Dashboard(
    workspace_slug="my-workspace",
    app_slug="my-app",
    slug="first-dashboard",
    content=pie_widget,
)
Data#
This widget works with tabular data, typically in the form of a Pandas DataFrame.
Series #
Series(
    *,
    name: TemplatedStringItem = "Series",
    category_column: TemplatedStringItem = "category",
    data_column: TemplatedStringItem = "value",
    formatting: NumberFormatting | None = None,
    styling: Palette | SeriesStyling | None = None,
    tooltips: TooltipItems | None = None,
)
Define pie chart series.
Define a generic series for the pie chart, specifying category and data columns, formatting, styling, and tooltips.
Constructor for Series.
Parameters:
| Name | Type | Description | Default |
|---|---|---|---|
name
|
TemplatedStringItem
|
name for the Pie series. |
'Series'
|
category_column
|
TemplatedStringItem
|
name of column in pandas dataframe(s) that has category info within the pie. |
'category'
|
data_column
|
TemplatedStringItem
|
name of column in pandas dataframe(s) that has pie data. |
'value'
|
formatting
|
NumberFormatting | None
|
spec for number formatting. |
None
|
styling
|
Palette | SeriesStyling | None
|
spec for pie series styling. |
None
|
tooltips
|
TooltipItems | None
|
tooltip items to be displayed at Series level. |
None
|
Examples:#
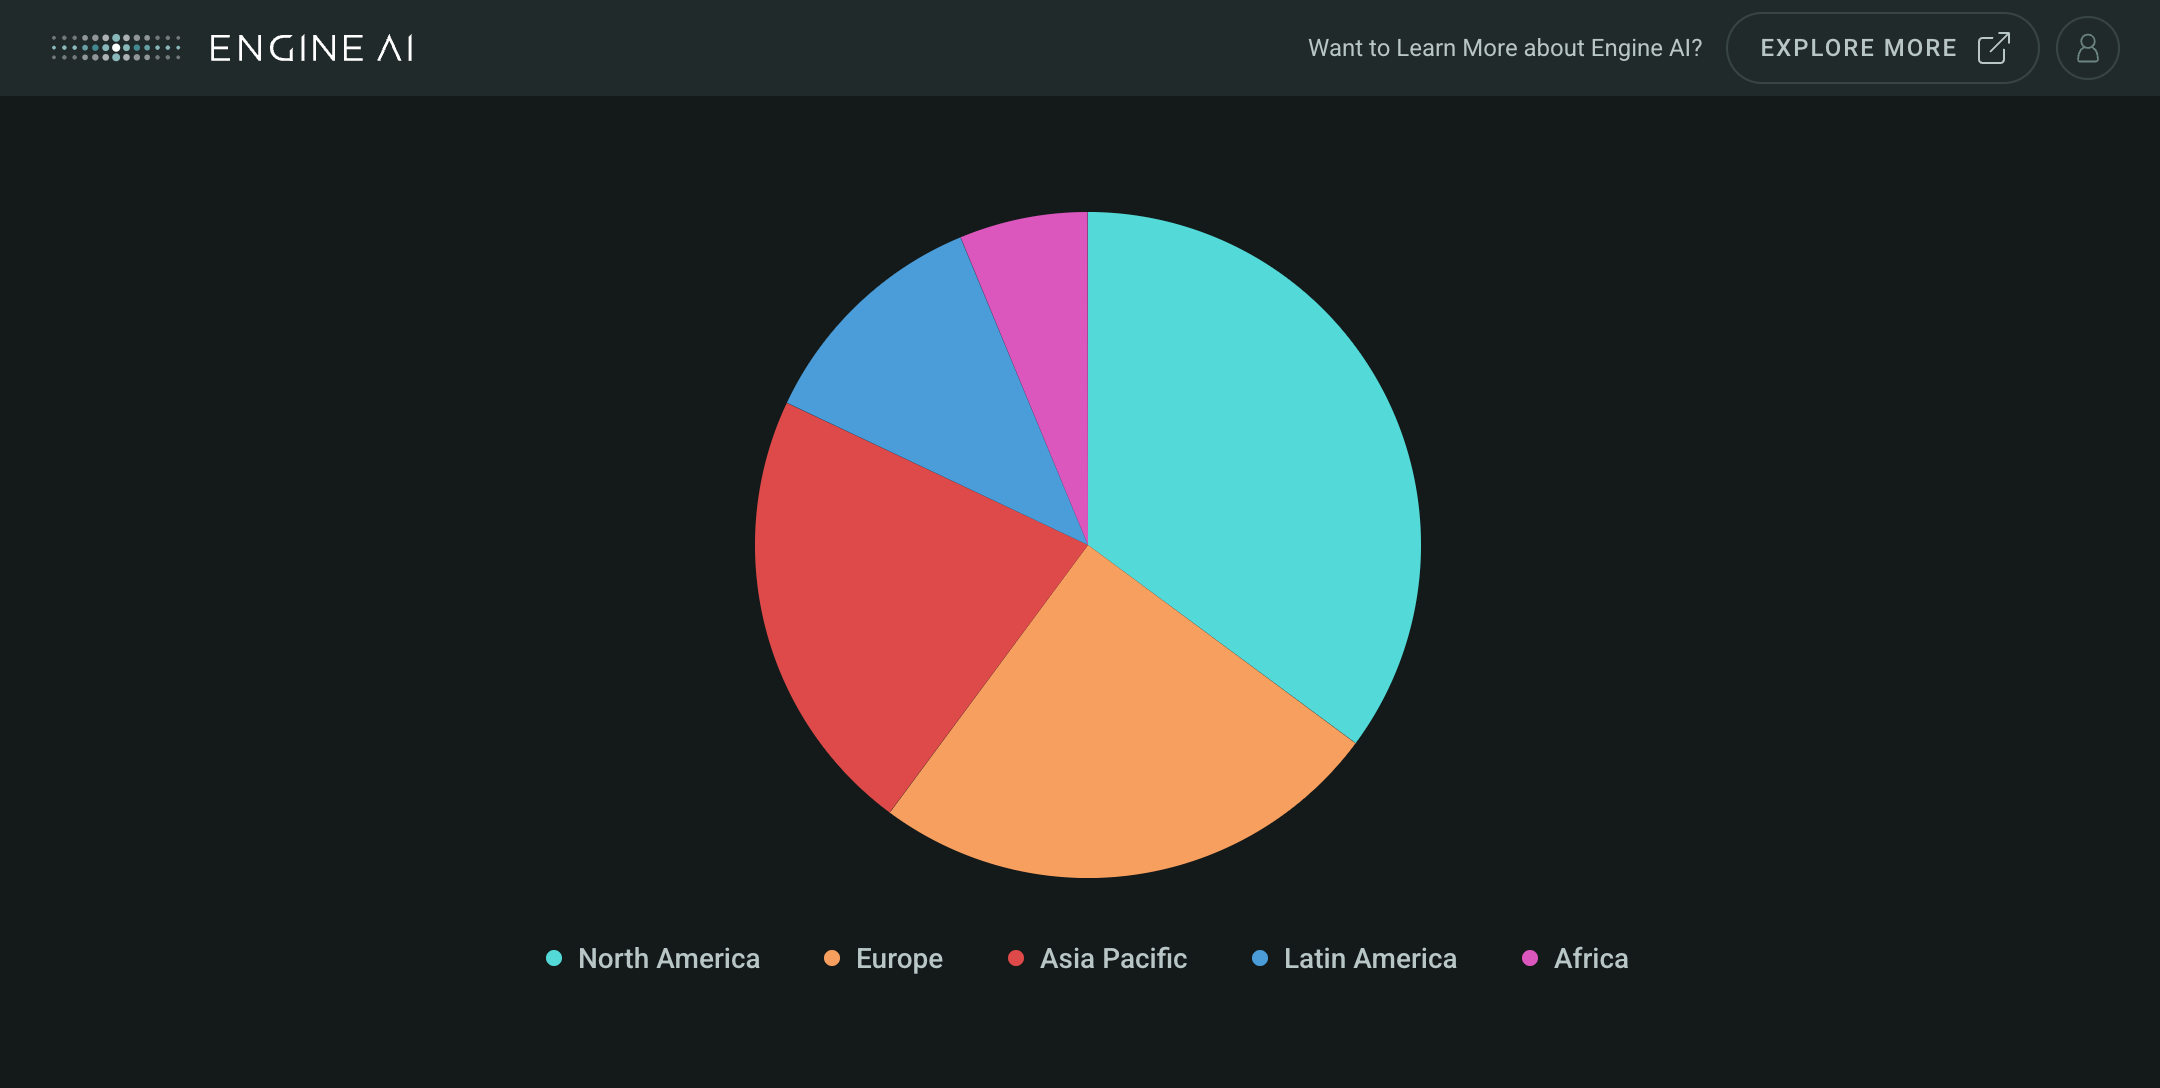
Customise Pie widget series (e.g. changing data column)
import pandas as pd

from engineai.sdk.dashboard.dashboard import Dashboard
from engineai.sdk.dashboard.widgets import pie

data = pd.DataFrame(
    {
        "region": [
            "North America",
            "Europe",
            "Asia Pacific",
            "Latin America",
            "Africa",
        ],
        "sales": [45000, 32000, 28000, 15000, 8000],
    }
)

pie_widget = pie.Pie(
    data=data,
    series=pie.Series(
        category_column="region",
        data_column="sales",
    ),
)

Dashboard(
    workspace_slug="my-workspace",
    app_slug="my-app",
    slug="first-dashboard",
    content=pie_widget,
)
CountrySeries #
CountrySeries(
    *,
    name: TemplatedStringItem = "Country Series",
    country_column: TemplatedStringItem = "country_code",
    data_column: TemplatedStringItem = "value",
    formatting: NumberFormatting | None = None,
    styling: Palette | SeriesStyling | None = None,
    tooltips: TooltipItems | None = None,
)
Define country-based pie chart series.
Define a series specifically for pie charts representing data categorized by country, with options for customizing country code column, data column, formatting, styling, and tooltips.
Constructor for CountrySeries.
Parameters:
| Name | Type | Description | Default |
|---|---|---|---|
name
|
TemplatedStringItem
|
name for the Pie series. |
'Country Series'
|
country_column
|
TemplatedStringItem
|
name of column in pandas dataframe(s) that has country code within the pie. |
'country_code'
|
data_column
|
TemplatedStringItem
|
name of column in pandas dataframe(s) that has pie data. |
'value'
|
formatting
|
NumberFormatting | None
|
spec for number formatting. |
None
|
styling
|
Palette | SeriesStyling | None
|
spec for pie series styling. |
None
|
tooltips
|
TooltipItems | None
|
tooltip items to be displayed at Series level. |
None
|
Examples:#
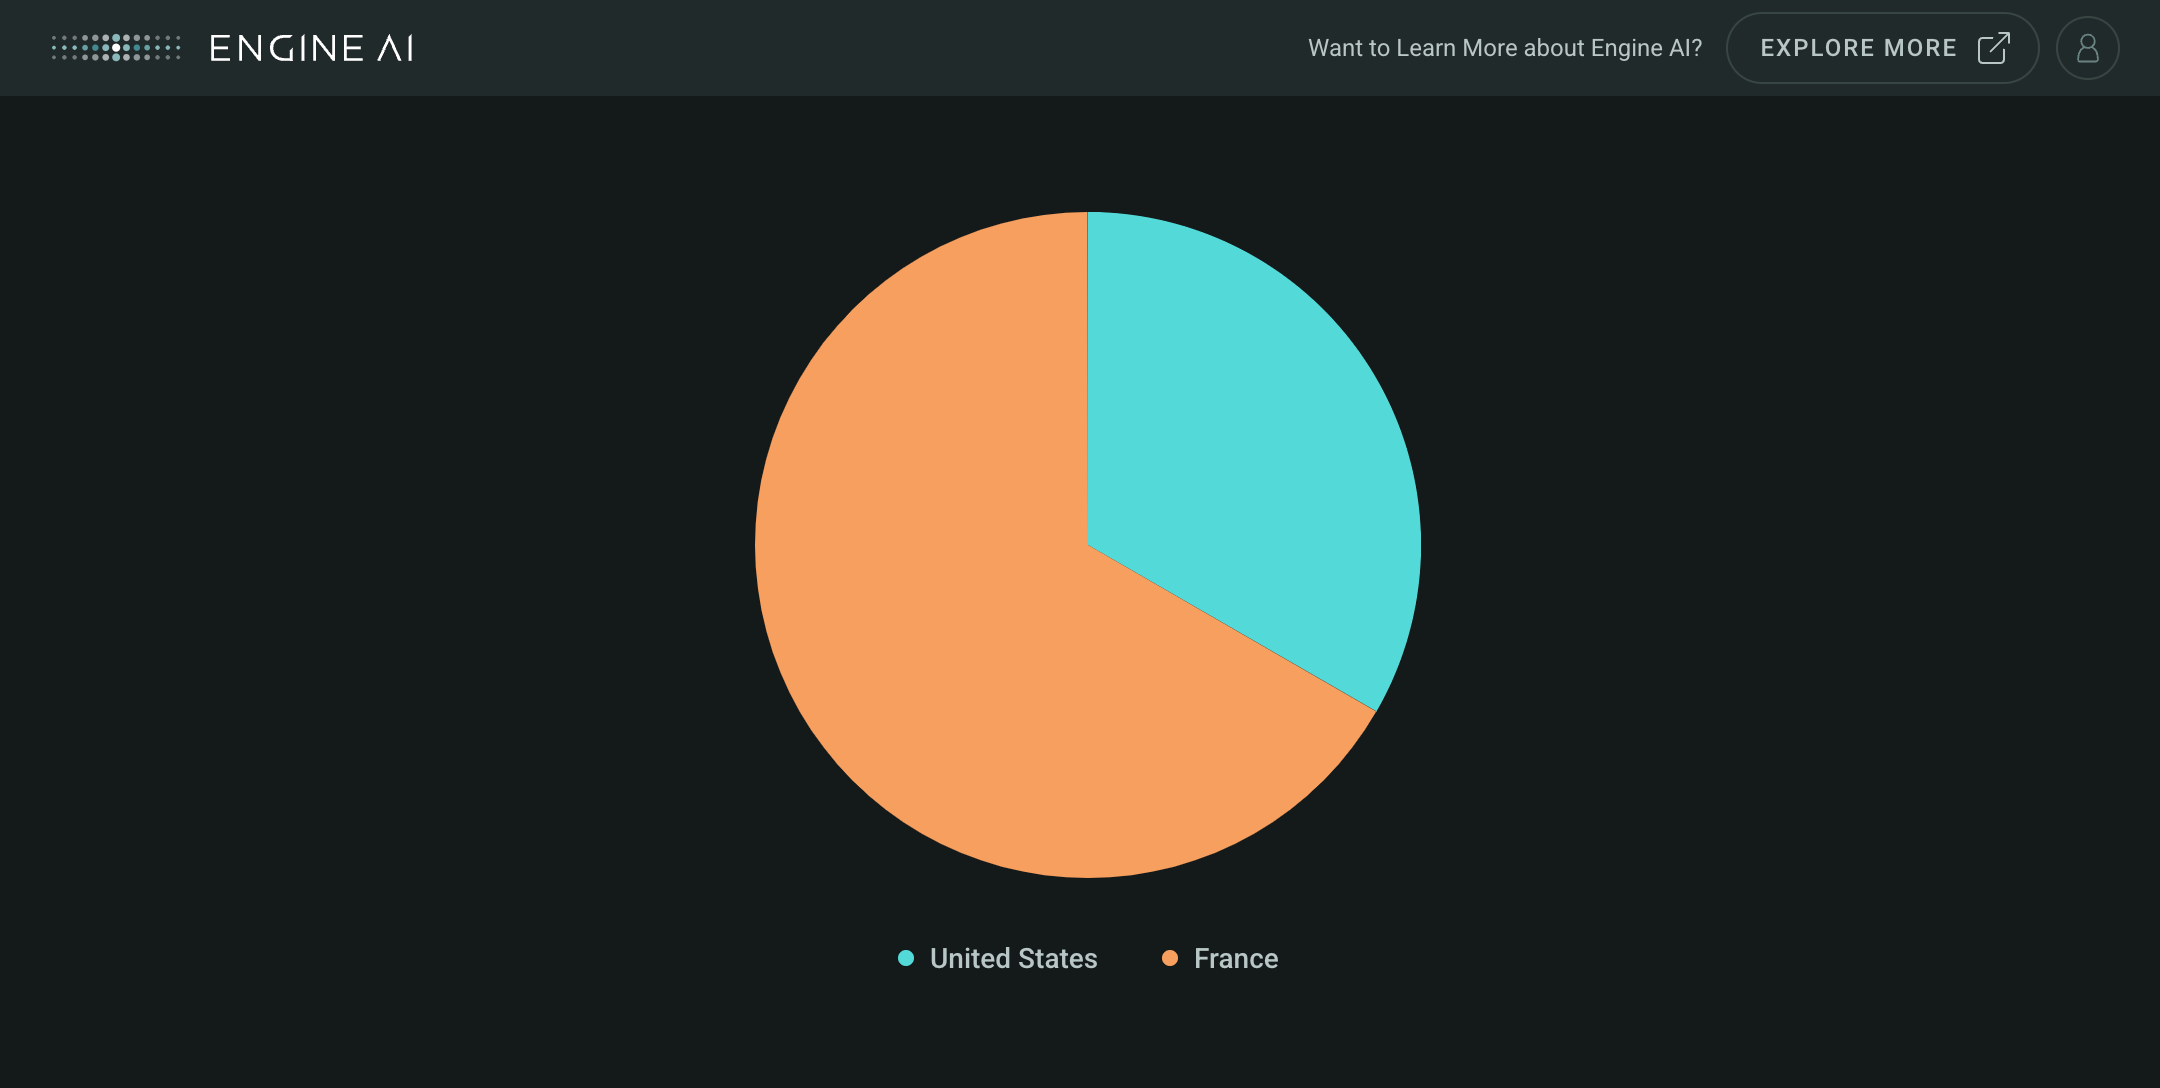
Create Pie widget using a CountrySeries
import pandas as pd

from engineai.sdk.dashboard.dashboard import Dashboard
from engineai.sdk.dashboard.widgets import pie

data = pd.DataFrame(
    {
        "country": ["US", "FR"],
        "volume": [10, 20],
    },
)

pie_widget = pie.Pie(
    data=data,
    series=pie.CountrySeries(
        country_column="country",
        data_column="volume",
    ),
)

Dashboard(
    workspace_slug="my-workspace",
    app_slug="my-app",
    slug="first-dashboard",
    content=pie_widget,
)
SeriesStyling #
SeriesStyling(
    color_spec: ColorSpec | None = None,
    data_column: TemplatedStringItem | None = None,
)
Style pie chart series.
Specify styling options for pie chart series, including color specifications and data column mapping.
Constructor for SeriesStyling.
Parameters:
| Name | Type | Description | Default |
|---|---|---|---|
color_spec
|
ColorSpec | None
|
specs for color. |
None
|
data_column
|
TemplatedStringItem | None
|
name of column in pandas dataframe(s) that has the styling value. |
None
|
Enums#
LegendPosition #
Legend position options.
Options for positioning the legend on the pie chart, including right, bottom, and next to the data.
Attributes:
| Name | Type | Description |
|---|---|---|
RIGHT |
Legend is placed on the right side of the chart. |
|
BOTTOM |
Legend is placed on the bottom of the chart. |
|
NEXT_TO_DATA |
Legend is placed next to the data. |