GeoPlayback#
GeoPlayback #
GeoPlayback(
    data: DataType | StaticDataType,
    *,
    playback: Playback,
    series: MapSeries | None = None,
    region_column: str = "region",
    color_axis: ColorAxis | None = None,
    widget_id: str | None = None,
    title: WidgetTitleType | None = None,
    legend_position: LegendPosition = BOTTOM,
    styling: MapStyling | None = None,
    region: Region = WORLD,
    tooltips: TooltipItems | None = None,
)
Widget for tailored geographic data visualization.
Allows the construction of a widget specifically tailored for geographical data visualization.
Constructor for Map Geo widget.
Parameters:
| Name | Type | Description | Default |
|---|---|---|---|
data
|
DataType | StaticDataType
|
data source for the widget. |
required |
series
|
MapSeries | None
|
Series to be added to y axis. |
None
|
region_column
|
str
|
key to match region code in DS. |
'region'
|
widget_id
|
str | None
|
unique widget id in a dashboard. |
None
|
color_axis
|
ColorAxis | None
|
color axis spec. |
None
|
title
|
WidgetTitleType | None
|
title of widget can be either a string (fixed value) or determined by a value from another widget using a WidgetField. |
None
|
legend_position
|
LegendPosition
|
location of position relative to data, maps. |
BOTTOM
|
styling
|
MapStyling | None
|
styling for the map. |
None
|
region
|
Region
|
sets the region os the Map. |
WORLD
|
tooltips
|
TooltipItems | None
|
tooltip items to be displayed at Chart level. |
None
|
playback
|
Playback
|
playback spec for the map. |
required |
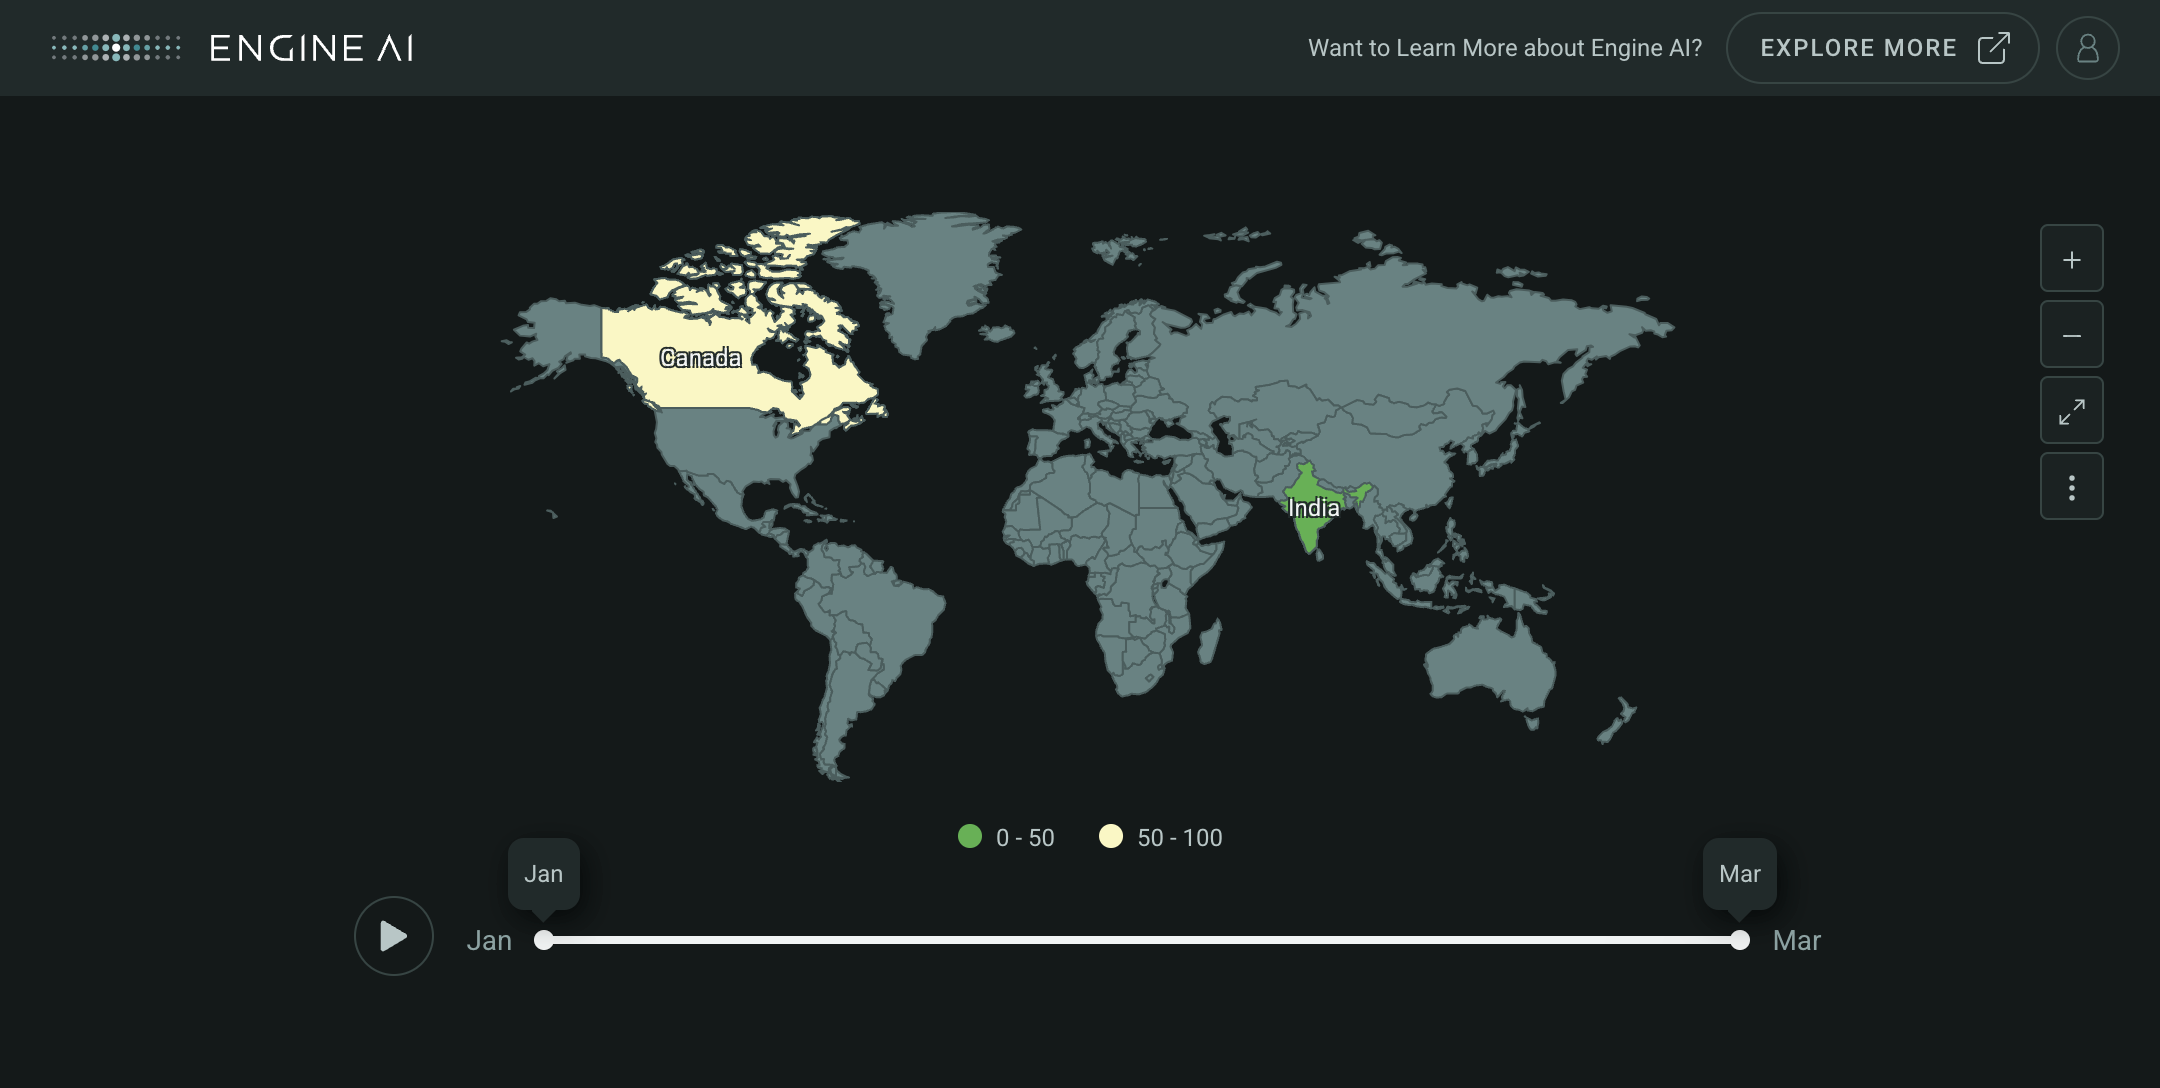
Examples:#
Create a Geo Playback widget
import pandas as pd

from engineai.sdk.dashboard.dashboard import Dashboard
from engineai.sdk.dashboard.styling.color import DiscreteMap, DiscreteMapIntervalItem, Palette
from engineai.sdk.dashboard.widgets import maps

map_data = {}
frames = []
data = [[76, 24], [23, 53], [13, 11]]

for month, values in zip(["Jan", "Feb", "Mar"], data, strict=False):
    map_data[month] = [
        {
            "region": "CA",
            "value": values[0],
        },
        {
            "region": "IN",
            "value": values[1],
        },
    ]
    frames.append({"id": month})

map_widget = maps.GeoPlayback(
    data=map_data,
    series=maps.NumericSeries(
        data_column="value",
        styling=maps.SeriesStyling(
            color_spec=DiscreteMap(
                DiscreteMapIntervalItem(
                    min_value=0, max_value=50, color=Palette.GRASS_GREEN
                ),
                DiscreteMapIntervalItem(
                    min_value=50, max_value=100, color=Palette.LEMON_YELLOW
                ),
            )
        ),
    ),
    playback=maps.Playback(
        data=pd.DataFrame(frames),
    ),
)

Dashboard(
    workspace_slug="my-workspace",
    app_slug="my-app",
    slug="first-dashboard",
    content=map_widget,
)
Data#
This widget works with tabular data, typically in the form of a Pandas DataFrame.
Playback #
Playback(
    *,
    id_column: str = "id",
    data: DataType | DataFrame,
    label_column: str | None = None,
    label_formatting: FormattingType | None = None,
    update_interval: int = 1,
    loop: bool = False,
    auto_play: bool = False,
    initial_state: InitialState | None = None,
)
Spec for Playback widget.
Construct spec for Playback widget.
Parameters:
| Name | Type | Description | Default |
|---|---|---|---|
id_column
|
str
|
Id Column to match the field in the Data for the Frame. |
'id'
|
data
|
DataType | DataFrame
|
data for the widget. Can be a pandas dataframe or Storage object if the data is to be retrieved from a storage. |
required |
label_column
|
str | None
|
Label Column to match the field in the Data for the Frame Label. |
None
|
label_formatting
|
FormattingType | None
|
Class to modify the Frame Label Formatting. |
None
|
update_interval
|
int
|
Configuration for update interval. |
1
|
loop
|
bool
|
Configuration for Loop. |
False
|
auto_play
|
bool
|
Configuration for Auto Play. |
False
|
initial_state
|
InitialState | None
|
Class to add an initial state. |
None
|
InitialState #
Spec for InitialState widget.
Construct spec for Playback Initial State widget.
Parameters:
| Name | Type | Description | Default |
|---|---|---|---|
start_frame_id
|
str | None
|
column in Pandas DataFrame to define the starting frame. |
None
|
end_frame_id
|
str | None
|
column in Pandas DataFrame to define the ending frame. |
None
|