Your First Dashboard with Engine AI SDK#
This guide will walk you through creating your first interactive dashboard using the Engine AI SDK. We'll build a simple dashboard with one table, showing sales data by region, and a pie chart showing the population of different countries based on the table selection.
Prerequisites
For this section you need to setup a workspace, app and dashboard, go to the Setting Up Workspace section for more details if you haven't done so already.
Step 1: Import Required Components#
Begin by creating dashboard.py and importing the necessary components:
import pandas as pd

from engineai.sdk.dashboard.dashboard import Dashboard
from engineai.sdk.dashboard.widgets import pie
from engineai.sdk.dashboard.widgets import table
Step 2: Setup Data#
Prepare the sample sales data for the pie chart. We'll use a simple pandas DataFrame for this:
data = pd.DataFrame(
    {
        "region": [
            "North America",
            "Europe",
            "Asia Pacific",
            "Latin America",
            "Africa",
        ],
        "sales": [45000, 32000, 28000, 15000, 8000],
        "countries": [
            [
                {"name": "USA", "population": 331000000},
                {"name": "Canada", "population": 37700000},
            ],
            [
                {"name": "Germany", "population": 83700000},
                {"name": "France", "population": 65200000},
                {"name": "UK", "population": 67800000},
                {"name": "Italy", "population": 60000000},
            ],
            [
                {"name": "China", "population": 1400000000},
                {"name": "Japan", "population": 126000000},
            ],
            [
                {"name": "Brazil", "population": 213000000},
                {"name": "Argentina", "population": 45000000},
                {"name": "Mexico", "population": 126000000},
            ],
            [
                {"name": "Nigeria", "population": 206000000},
                {"name": "South Africa", "population": 60000000},
                {"name": "Kenya", "population": 54000000},
                {"name": "Egypt", "population": 102000000},
                {"name": "Morocco", "population": 37000000},
                {"name": "Ghana", "population": 31000000},
            ],
        ],
    }
)
This is just an example of data being input directly in the code. Alternatively, you can use one of the available Connectors to bring data into your application.
Step 3: Build a Table Widget#
Now, let's build a table widget that shows region and sales:
table_widget = table.Table(
    data=data,
    title="Sales by Region - Q4 2024",
    columns=["region", "sales"],
)
Step 4: Build the Pie Chart Widget#
Now, build the pie chart that will show the countries based on the selected region from the table.
pie_widget = pie.Pie(
    data=table_widget.selected.countries,
    title="Population by Country",
    series=pie.Series(
        category_column="name",  # This column defines the pie slices
        data_column="population",  # This column defines the slice sizes
    ),
)
In this example, we used a Pie Chart, but you can use other types of Widgets that are available.
Linking Widgets
The table_widget.selected.countries allows the pie chart to dynamically update based on the selected region in the table widget. For more information on linking widgets, refer to the Widgets Linking section.
Step 5: Instantiate Dashboard#
Instantiate the dashboard layout with the pie chart widget:
if __name__ == "__main__":
    Dashboard(
        workspace_slug="my-workspace",
        app_slug="my-app",
        slug="first-dashboard",
        content=[table_widget, pie_widget],
    )
Publishing the dashboard
Instantiating the Dashboard class also publishes it to the Engine AI platform.
Step 6: Publish Dashboard#
Finally, in order to publish the dashboard, run the following command in your terminal:
Navigate to the URL provided by the script. Your new dashboard should appear as follows:
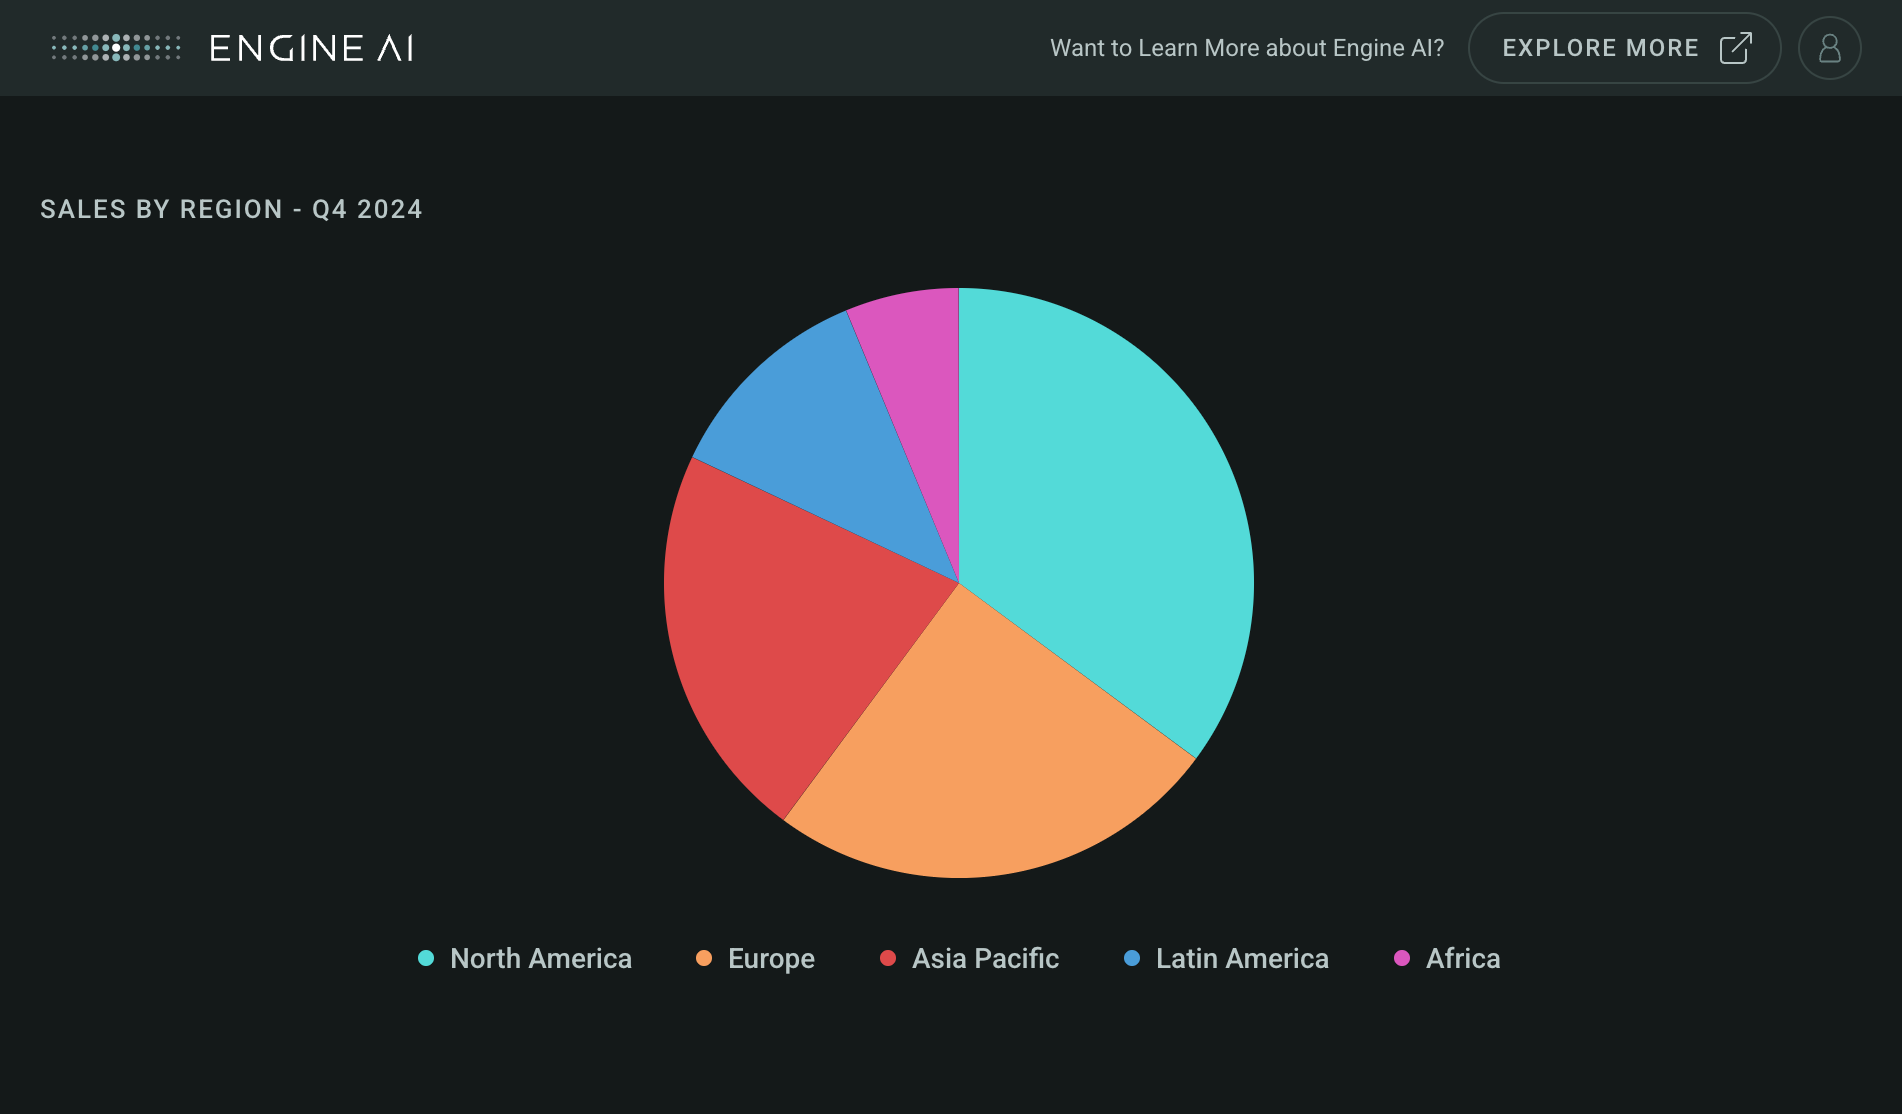
Congratulations! 🎉 You've successfully created your first interactive dashboard with the Engine AI SDK. This minimal example demonstrates how easy it is to get started with data visualization using the Engine AI platform.
Complete Example#
Here's the complete code that creates your first dashboard.
"""My first dashboard using Engine AI SDK."""

import pandas as pd

from engineai.sdk.dashboard.dashboard import Dashboard
from engineai.sdk.dashboard.widgets import pie
from engineai.sdk.dashboard.widgets import table


data = pd.DataFrame(
    {
        "region": [
            "North America",
            "Europe",
            "Asia Pacific",
            "Latin America",
            "Africa",
        ],
        "sales": [45000, 32000, 28000, 15000, 8000],
        "countries": [
            [
                {"name": "USA", "population": 331000000},
                {"name": "Canada", "population": 37700000},
            ],
            [
                {"name": "Germany", "population": 83700000},
                {"name": "France", "population": 65200000},
                {"name": "UK", "population": 67800000},
                {"name": "Italy", "population": 60000000},
            ],
            [
                {"name": "China", "population": 1400000000},
                {"name": "Japan", "population": 126000000},
            ],
            [
                {"name": "Brazil", "population": 213000000},
                {"name": "Argentina", "population": 45000000},
                {"name": "Mexico", "population": 126000000},
            ],
            [
                {"name": "Nigeria", "population": 206000000},
                {"name": "South Africa", "population": 60000000},
                {"name": "Kenya", "population": 54000000},
                {"name": "Egypt", "population": 102000000},
                {"name": "Morocco", "population": 37000000},
                {"name": "Ghana", "population": 31000000},
            ],
        ],
    }
)

table_widget = table.Table(
    data=data,
    title="Sales by Region - Q4 2024",
    columns=["region", "sales"],
)

pie_widget = pie.Pie(
    data=table_widget.selected.countries,
    title="Population by Country",
    series=pie.Series(
        category_column="name",  # This column defines the pie slices
        data_column="population",  # This column defines the slice sizes
    ),
)

if __name__ == "__main__":
    Dashboard(
        workspace_slug="my-workspace",
        app_slug="my-app",
        slug="first-dashboard",
        content=[table_widget, pie_widget],
    )