Sample Dashboard#
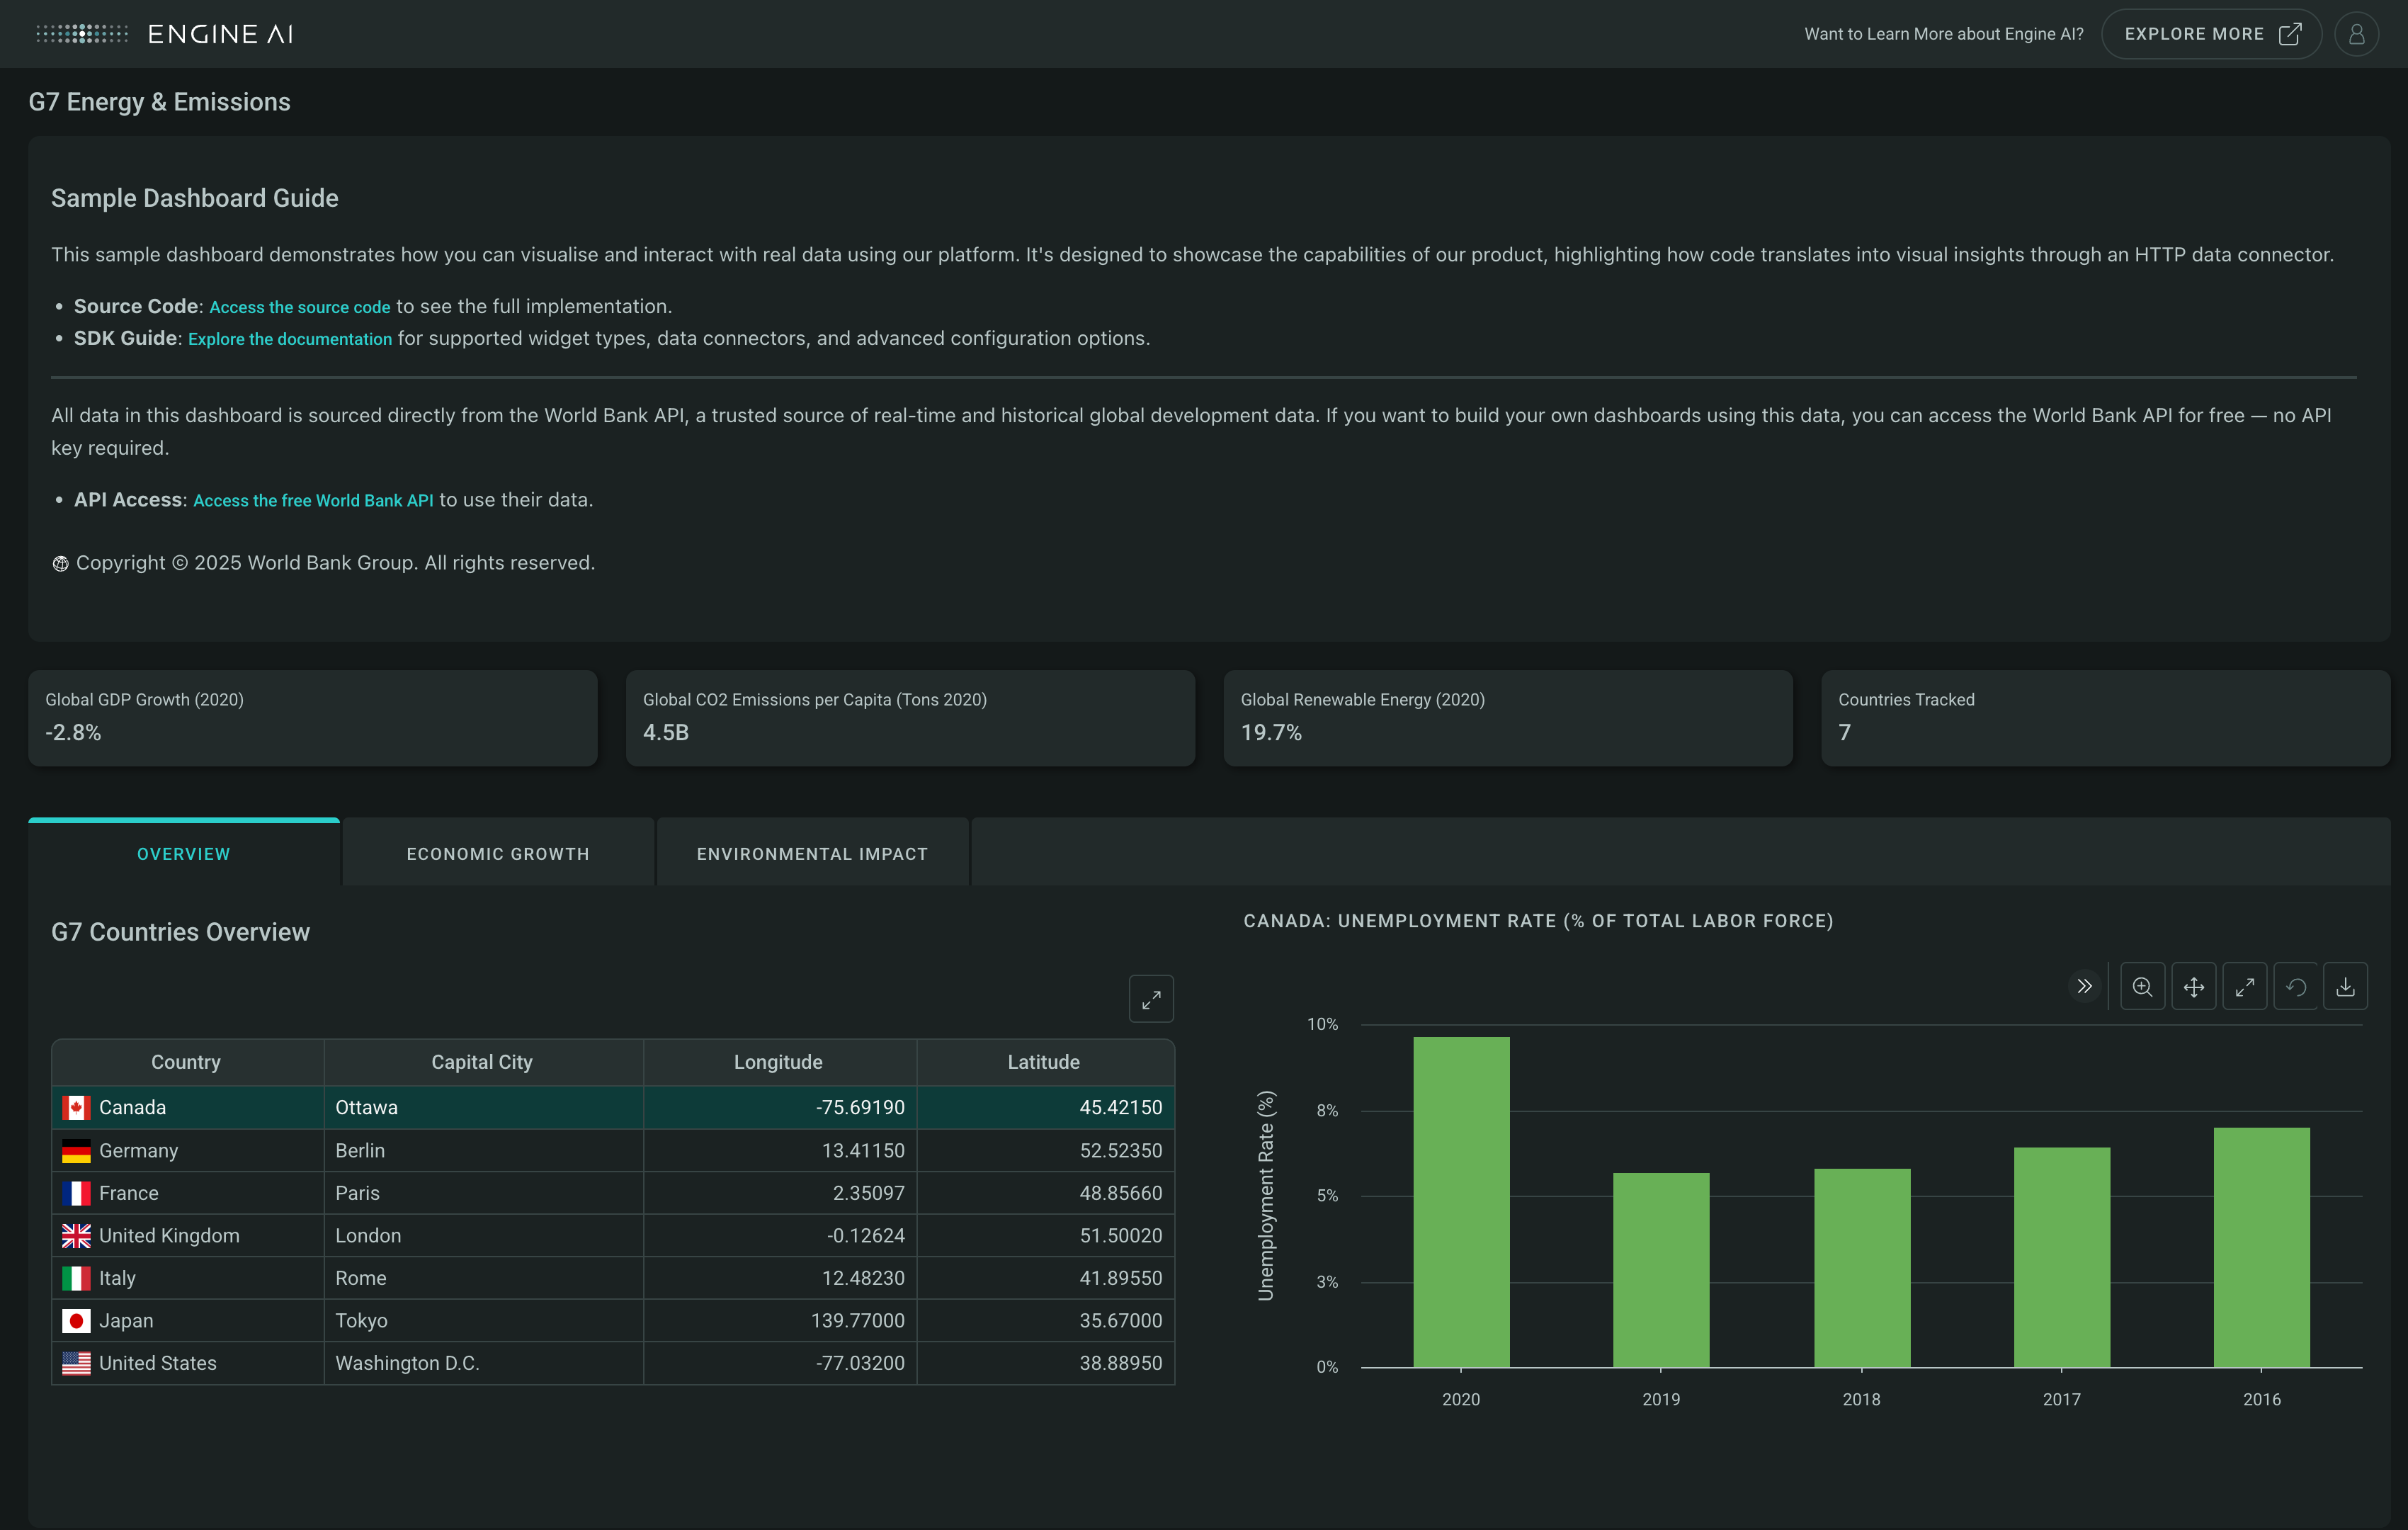
This page contains the complete source code for the Sample Dashboard that visualizes World Bank development data, and which exists in your workspace by default.
HTTP Connector Configuration#
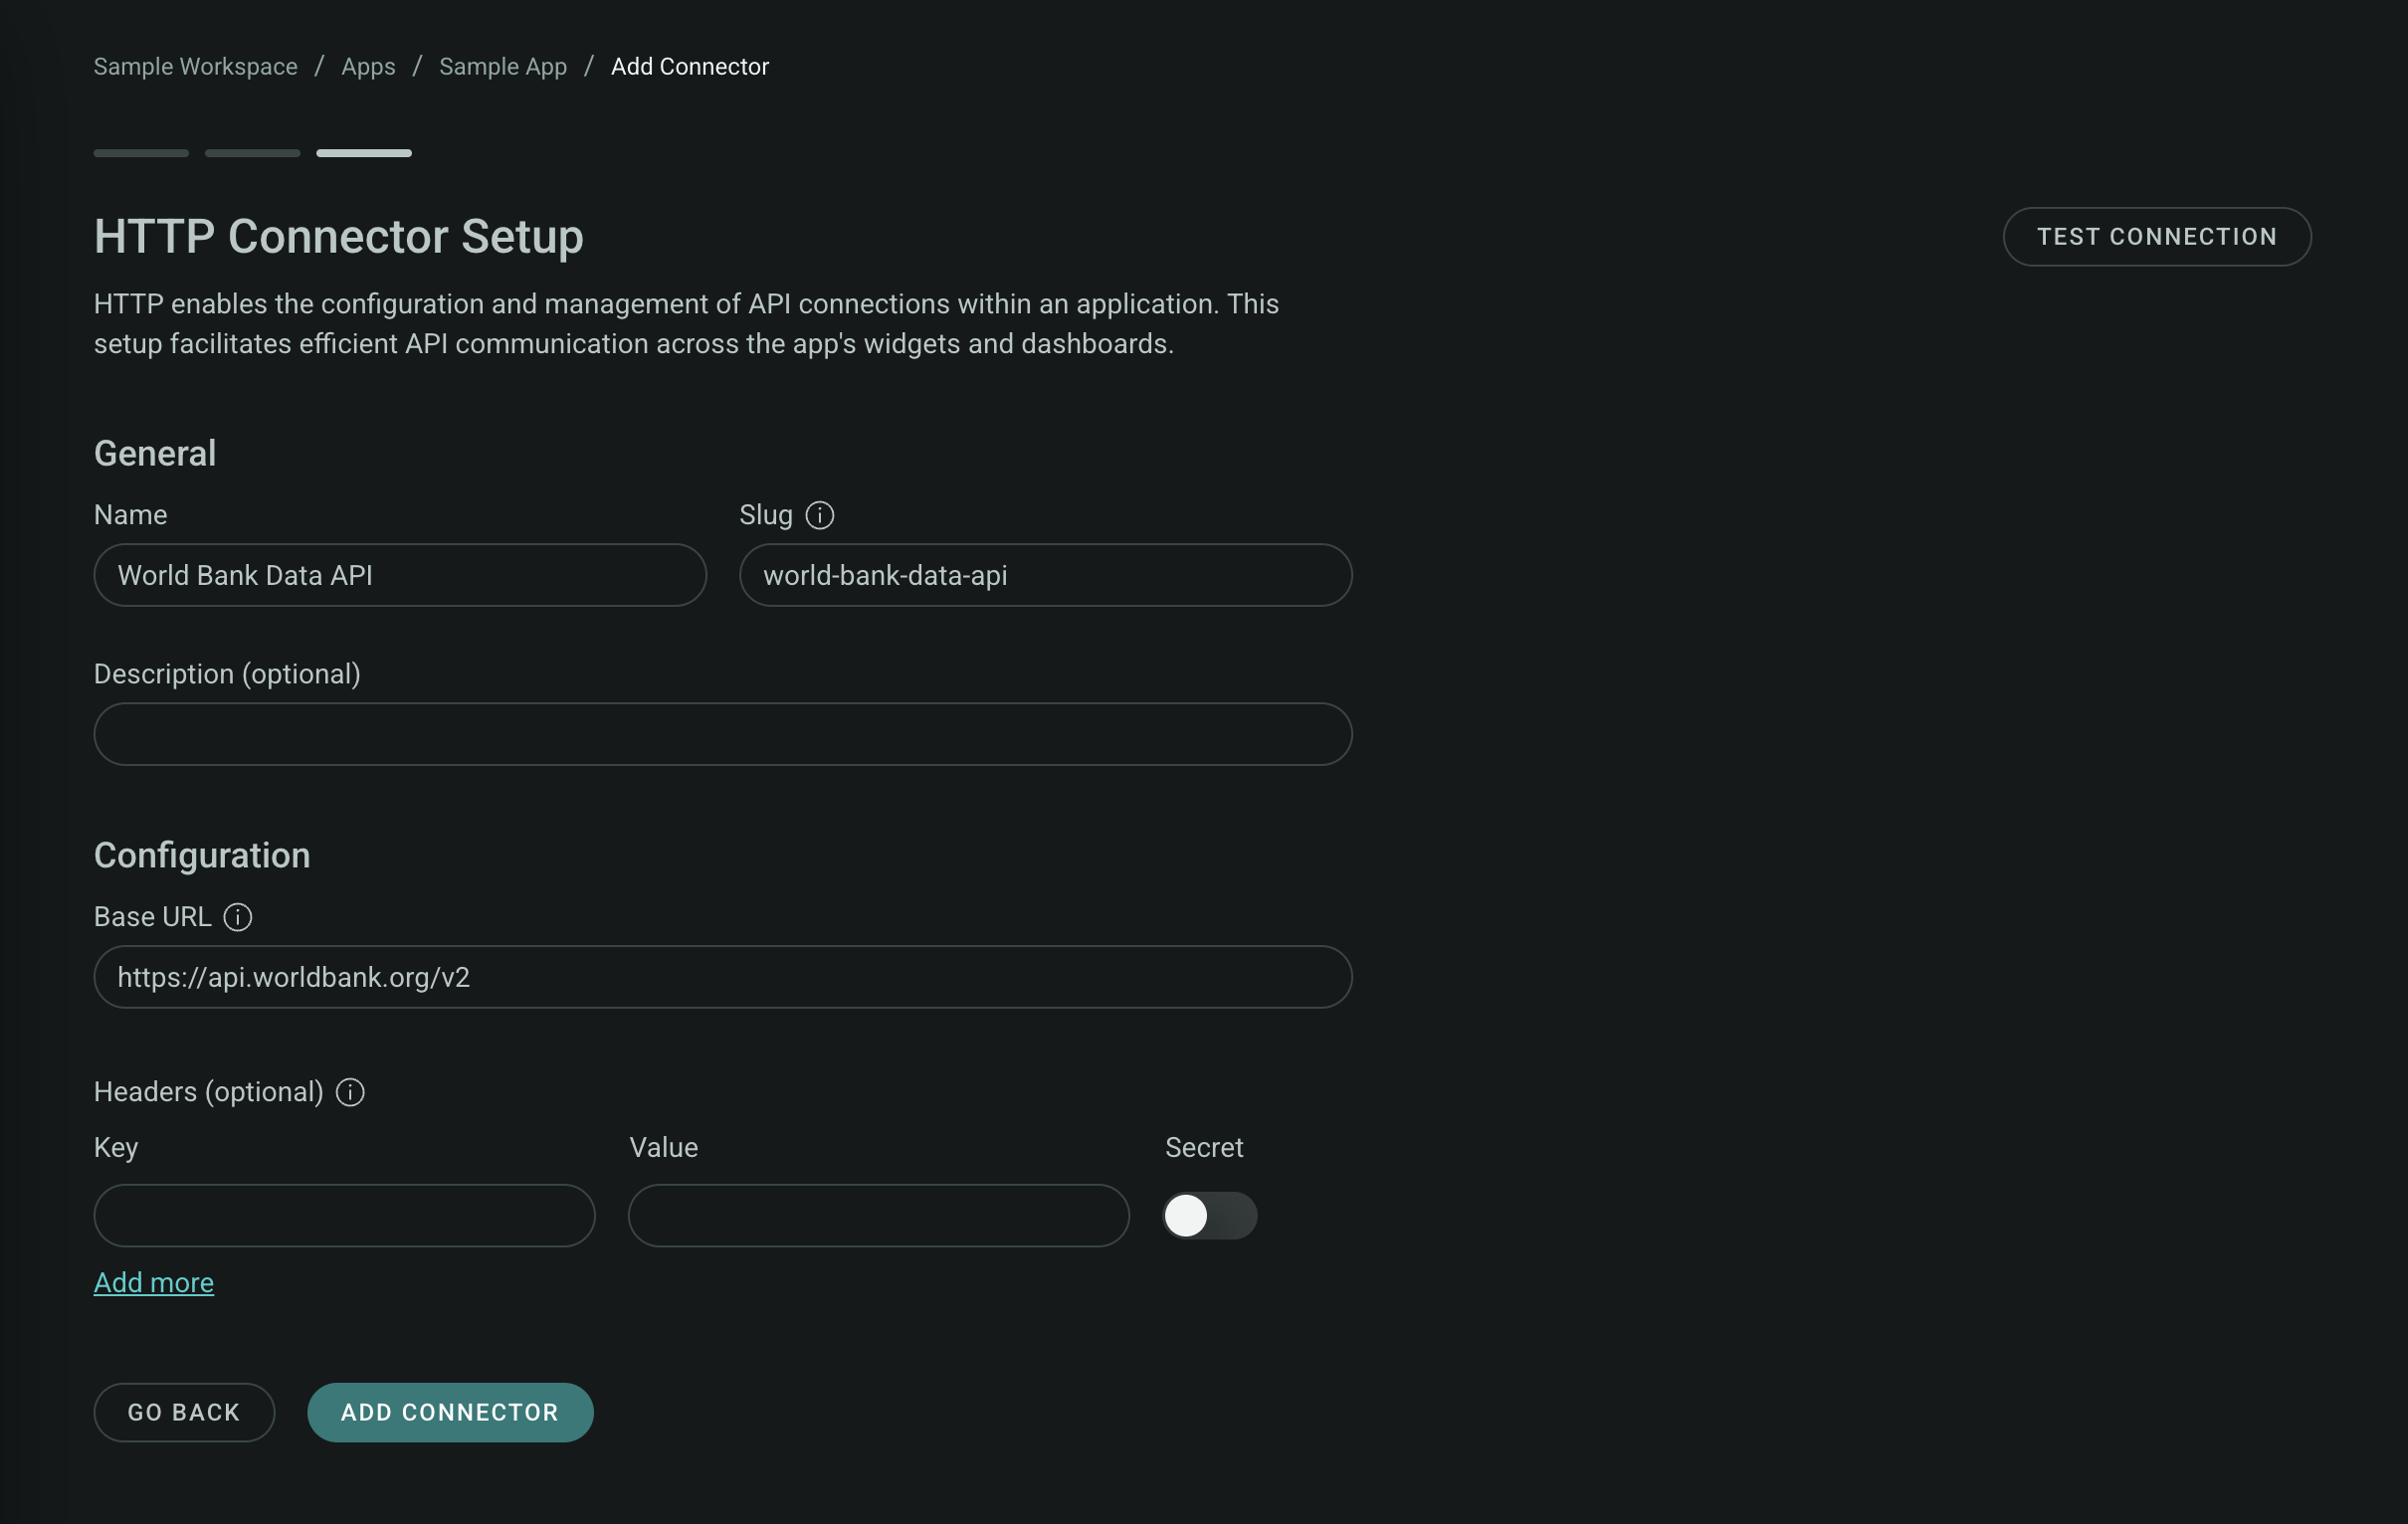
For this dashboard, we use an HTTP Connector as a data source. You can visit our HTTP Connector Setup page to learn more on how to configure the connector. It should look like this:
Source Code#
While you explore the dashboard, you can follow along with the implementation below.
from engineai.sdk.dashboard import dashboard
from engineai.sdk.dashboard import formatting
from engineai.sdk.dashboard import layout
from engineai.sdk.dashboard.data.connectors import HttpGet
from engineai.sdk.dashboard.styling import color
from engineai.sdk.dashboard.widgets import categorical
from engineai.sdk.dashboard.widgets import content
from engineai.sdk.dashboard.widgets import pie
from engineai.sdk.dashboard.widgets import table
from engineai.sdk.dashboard.widgets import tile
from engineai.sdk.dashboard.widgets.components.charts import styling
from engineai.sdk.dashboard.widgets.components.charts.axis import scale

introduction_items = {
    "title": "# Sample Dashboard Guide",
    "content": """
This sample dashboard demonstrates how you can visualise and interact with real data using our platform. It's designed to showcase the capabilities of our product, highlighting how code translates into visual insights through an HTTP data connector.
- **Source Code**: [Access the source code](https://docs.engineai.com/sdk/getting_started/sample_dashboard.html) to see the full implementation.
- **SDK Guide**: [Explore the documentation](https://docs.engineai.com/sdk/core_concepts/overview.html) for supported widget types, data connectors, and advanced configuration options.

---

All data in this dashboard is sourced directly from the World Bank API, a trusted source of real-time and historical global development data.
If you want to build your own dashboards using this data, you can access the World Bank API for free — no API key required.
- **API Access**: [Access the free World Bank API](https://datahelpdesk.worldbank.org/knowledgebase/topics/125589-developer-information) to use their data.

:world-bank: Copyright © 2025 World Bank Group. All rights reserved.
""",
}

introductory_section = content.Content(
    data=introduction_items,
).add_items(
    content.MarkdownItem(data_key="title"), content.MarkdownItem(data_key="content")
)

tiles = [
    tile.Tile(
        data=HttpGet(
            slug="sample-http-connector",
            path="/country/1W/indicator/NY.GDP.MKTP.KD.ZG?date=2020&format=json",
        )._1._0,
        items=[
            tile.NumberItem(
                data_column="value",
                label="Global GDP Growth (2020)",
                formatting=formatting.NumberFormatting(
                    scale=formatting.NumberScale.BASE, decimals=1, suffix="%"
                ),
                styling=tile.NumberStylingArrow(
                    data_column="value",
                    color_divergent=color.Divergent(
                        mid_value=0,
                        mid_color=color.Palette.COCONUT_GREY,
                        above_color=color.Palette.BLUE_POSITIVE_4,
                        below_color=color.Palette.RED_NEGATIVE_4,
                    ),
                ),
            ),
        ],
    ),
    tile.Tile(
        data=HttpGet(
            slug="sample-http-connector",
            path="/country/1W/indicator/EN.GHG.CO2.PC.CE.AR5?date=2020&format=json",
        )._1._0,
        items=[
            tile.NumberItem(
                data_column="value",
                label="Global CO2 Emissions per Capita (Tons 2020)",
                formatting=formatting.NumberFormatting(
                    scale=formatting.NumberScale.BASE, decimals=1, suffix="B"
                ),
            ),
        ],
    ),
    tile.Tile(
        HttpGet(
            slug="sample-http-connector",
            path="/country/1W/indicator/EG.FEC.RNEW.ZS?date=2020&format=json",
        )._1._0,
        items=[
            tile.NumberItem(
                data_column="value",
                label="Global Renewable Energy (2020)",
                formatting=formatting.NumberFormatting(
                    scale=formatting.NumberScale.BASE, decimals=1, suffix="%"
                ),
            ),
        ],
    ),
    tile.Tile(
        data=HttpGet(
            slug="sample-http-connector",
            path="/country?format=json&per_page=1",
        )._0,
        items=[
            tile.NumberItem(
                data_column="total",
                label="Countries Tracked",
            ),
        ],
    ),
]

general_overview = table.Table(
    data=HttpGet(
        slug="sample-http-connector",
        path="/country/CA;FR;DE;IT;JP;GB;US?format=json",
    )._1,
    columns=[
        table.CountryColumn(
            data_column="iso2Code",
            label="Country",
        ),
        table.TextColumn(
            data_column="capitalCity",
            label="Capital City",
        ),
        table.NumberColumn(
            data_column="longitude",
            formatting=formatting.NumberFormatting(
                scale=formatting.NumberScale.DYNAMIC_ABSOLUTE, decimals=5
            ),
        ),
        table.NumberColumn(
            data_column="latitude",
            formatting=formatting.NumberFormatting(
                scale=formatting.NumberScale.DYNAMIC_ABSOLUTE, decimals=5
            ),
        ),
    ],
)

government_revenue = categorical.Categorical(
    title=f"{general_overview.selected.name}: Unemployment rate (% of total labor force)",
    data=HttpGet(
        slug="sample-http-connector",
        path=f"/country/{general_overview.selected.iso2Code}/indicator/SL.UEM.TOTL.ZS?format=json&date=2016:2020",
    )._1,
    category_axis="date",
    value_axis=categorical.ValueAxis(
        title="Unemployment Rate (%)",
        series=categorical.ColumnSeries(
            data_column="value",
            name="Unemployment Rate",
            show_in_legend=False,
            styling=styling.ColumnSeriesStyling(
                color_spec=color.Palette.GRASS_GREEN,
            ),
        ),
        scale=scale.AxisScalePositive(),
        formatting=formatting.AxisNumberFormatting(
            scale=formatting.NumberScale.BASE,
            decimals=2,
            suffix="%",
        ),
    ),
)

overview_tab = layout.Tab(
    label="Overview",
    content=layout.Grid(
        layout.Row(
            layout.Card(
                header=layout.CardHeader(title="G7 Countries Overview"),
                content=general_overview,
            ),
            layout.Card(content=layout.Grid(layout.Row(government_revenue))),
        ),
    ),
)

gdp_levels_color_map = color.DiscreteMap(
    color.DiscreteMapIntervalItem(
        min_value=0,
        max_value=15000,
        exclude_max=True,
        color=color.Palette.BLUE_POSITIVE_4,
    ),
    color.DiscreteMapIntervalItem(
        min_value=15000,
        max_value=35000,
        exclude_max=True,
        color=color.Palette.COCONUT_GREY,
    ),
    color.DiscreteMapIntervalItem(
        min_value=35000,
        max_value=70000,
        color=color.Palette.RED_NEGATIVE_4,
    ),
)

gdp_per_capita = categorical.Categorical(
    title="GDP Per Capita (2020)",
    data=HttpGet(
        slug="sample-http-connector",
        path="/country/CA;FR;DE;IT;JP;GB;US/indicator/NY.GDP.PCAP.CD?date=2020&format=json",
    )._1,
    category_axis="countryiso3code",
    value_axis=categorical.ValueAxis(
        title="GDP (USD)",
        series=categorical.ColumnSeries(
            data_column="value",
            name="GDP Per Capita",
            show_in_legend=False,
            styling=styling.ColumnSeriesStyling(
                color_spec=gdp_levels_color_map,
                marker_symbol=styling.enums.MarkerSymbol.CIRCLE,
            ),
        ),
        scale=scale.AxisScalePositive(),
        formatting=formatting.AxisNumberFormatting(
            scale=formatting.NumberScale.BASE, prefix="$", decimals=2
        ),
    ),
    direction=categorical.ChartDirection.HORIZONTAL,
)

gdp_growth = categorical.Categorical(
    title="GDP Growth (2020)",
    data=HttpGet(
        slug="sample-http-connector",
        path="/country/CA;FR;DE;IT;JP;GB;US/indicator/NY.GDP.MKTP.KD.ZG?date=2020&format=json",
    )._1,
    category_axis="countryiso3code",
    value_axis=categorical.ValueAxis(
        title="GDP Growth (Annual %)",
        series=categorical.PointSeries(
            data_column="value",
            name="GDP Growth",
            show_in_legend=False,
        ),
        scale=scale.AxisScaleDynamic(),
        formatting=formatting.AxisNumberFormatting(
            scale=formatting.NumberScale.BASE, suffix="%", decimals=2
        ),
    ),
)

economic_growth_tab = layout.Tab(
    label="Economic Growth",
    content=layout.Card(
        header=layout.CardHeader(title="Economic Growth Analysis"),
        content=layout.Grid(
            layout.Row(
                gdp_per_capita,
                gdp_growth,
            ),
        ),
    ),
)

co2_emission_by_country = categorical.Categorical(
    title="CO2 Emissions excluding LULUCF by Country (2020)",
    data=HttpGet(
        slug="sample-http-connector",
        path="/country/CA;FR;DE;IT;JP;GB;US/indicator/EN.GHG.CO2.MT.CE.AR5?date=2020&format=json",
    )._1,
    category_axis="countryiso3code",
    value_axis=categorical.ValueAxis(
        title="CO2 Emissions (Million Tons)",
        series=categorical.ColumnSeries(
            data_column="value",
            name="CO2 Emissions",
            show_in_legend=False,
            styling=styling.ColumnSeriesStyling(
                color_spec=color.DiscreteMap(
                    color.DiscreteMapIntervalItem(
                        min_value=0,
                        max_value=50,
                        exclude_max=True,
                        color="#2CCECB",
                    ),
                    color.DiscreteMapIntervalItem(
                        min_value=50,
                        max_value=100,
                        exclude_max=True,
                        color="#ABEDEC",
                    ),
                    color.DiscreteMapIntervalItem(
                        min_value=100,
                        max_value=300,
                        exclude_max=True,
                        color=color.Palette.BANANA_YELLOW,
                    ),
                    color.DiscreteMapIntervalItem(
                        min_value=300,
                        max_value=1000,
                        exclude_max=True,
                        color=color.Palette.SUNSET_ORANGE,
                    ),
                    color.DiscreteMapIntervalItem(
                        min_value=1000,
                        max_value=5000,
                        exclude_max=True,
                        color=color.Palette.TIGER_ORANGE,
                    ),
                    color.DiscreteMapIntervalItem(
                        min_value=5000,
                        max_value=1000000,
                        color=color.Palette.RED_NEGATIVE_4,
                    ),
                ),
                marker_symbol=styling.enums.MarkerSymbol.CIRCLE,
            ),
        ),
        scale=scale.AxisScalePositive(),
        formatting=formatting.AxisNumberFormatting(
            scale=formatting.NumberScale.BASE, decimals=2, suffix=" Mt"
        ),
    ),
)

renewable_energy = pie.Pie(
    title="Renewable Energy Consumption (2020)",
    data=HttpGet(
        slug="sample-http-connector",
        path="/country/CA;FR;DE;IT;JP;GB;US/indicator/EG.FEC.RNEW.ZS?format=json&date=2020",
    )._1,
    series=pie.Series(
        data_column="value",
        category_column="countryiso3code",
        name="",
        formatting=formatting.NumberFormatting(
            scale=formatting.NumberScale.BASE, decimals=1, suffix="%"
        ),
    ),
)

environmental_impact_tab = layout.Tab(
    label="Environmental Impact",
    content=layout.Card(
        header=layout.CardHeader(title="Environmental Impact Assessment"),
        content=layout.Grid(
            layout.Row(
                renewable_energy,
                co2_emission_by_country,
            ),
        ),
    ),
)

dashboard.Dashboard(
    workspace_slug="sample-workspace",
    app_slug="sample-app",
    slug="sample-dashboard",
    content=dashboard.Page(
        title="G7 Energy & Emissions",
        content=dashboard.RootGrid(
            # Uncomment the line below to include the introductory section at the top of the dashboard
            # layout.Row(layout.Card(content=introductory_section), height=3.25),
            layout.Row(*tiles),
            layout.TabSection(
                overview_tab, economic_growth_tab, environmental_impact_tab
            ),
        ),
    ),
)
Note
Do not forget to replace the workspace_slug with your actual slug.
Start Experimenting#
If you want to play around with the code, these resources will guide you through the process:
- Your First Dashboard - Follow our step-by-step tutorial to build your own dashboard
- Core Concepts - Understand the fundamental building blocks
- API Reference - Explore detailed documentation for all available components